District heating and heat network design, settled in one model.
Sympheny's optimisation engine sizes the network, selects the supply mix and stages the build in the same run, so your engineers compare cost against carbon on real hourly demand and hand stakeholders a concept they can fund.

Every optimised network scenario on one chart: life-cycle cost against carbon, produced from a single project.
Why heat network decisions are hard to get right.
The cheap answer and the clean answer are rarely the same
Decarbonisation targets push for renewable supply; budgets push the other way. Comparing a heat-pump network against waste heat against a gas-backed scheme one option at a time means most teams test a handful of combinations when the real decision space runs into the dozens.
The network gets fixed before it is understood
Temperature regime, route and connection order tend to be chosen early, often on instinct, because modelling high-temperature, low-temperature and ambient options properly takes too long under a deadline. That early choice then locks in cost for the life of the asset.
A spreadsheet no longer carries the case
Funders, municipalities and zoning submissions want the evidence behind the numbers. A model nobody outside the team can interrogate does not win the commission or the subsidy the way it once did.
Proven from a single expansion to a whole city.
District heating expansion across 74 buildings, five candidate network segments and three plants. Three of four scenarios were profitable above 80% renewable supply, with the build order staged.
Read case studyA low-temperature thermal network on river and groundwater, modelled across six hubs and stress-tested against more than 30 price and demand scenarios.
Read case studyA city-wide supply strategy over a 3.2 million m² reference area, confirming a CO₂-free supply by 2035 at life-cycle costs comparable to 2018.
Read case studyA net-zero commercial park concept reaching about 75% lower CO₂ at roughly 20% lower lifecycle cost than the conventional reference design.
Read case studyOne multi-energy hub model, from heat source to connection order.
The network segments, the plant operation, the technology mix and the connection timing all sit inside the same mixed-integer optimisation, solved at hourly resolution across a full reference year. Nothing is compared across separate studies built on different assumptions.
The network is a decision variable, not a fixed input.
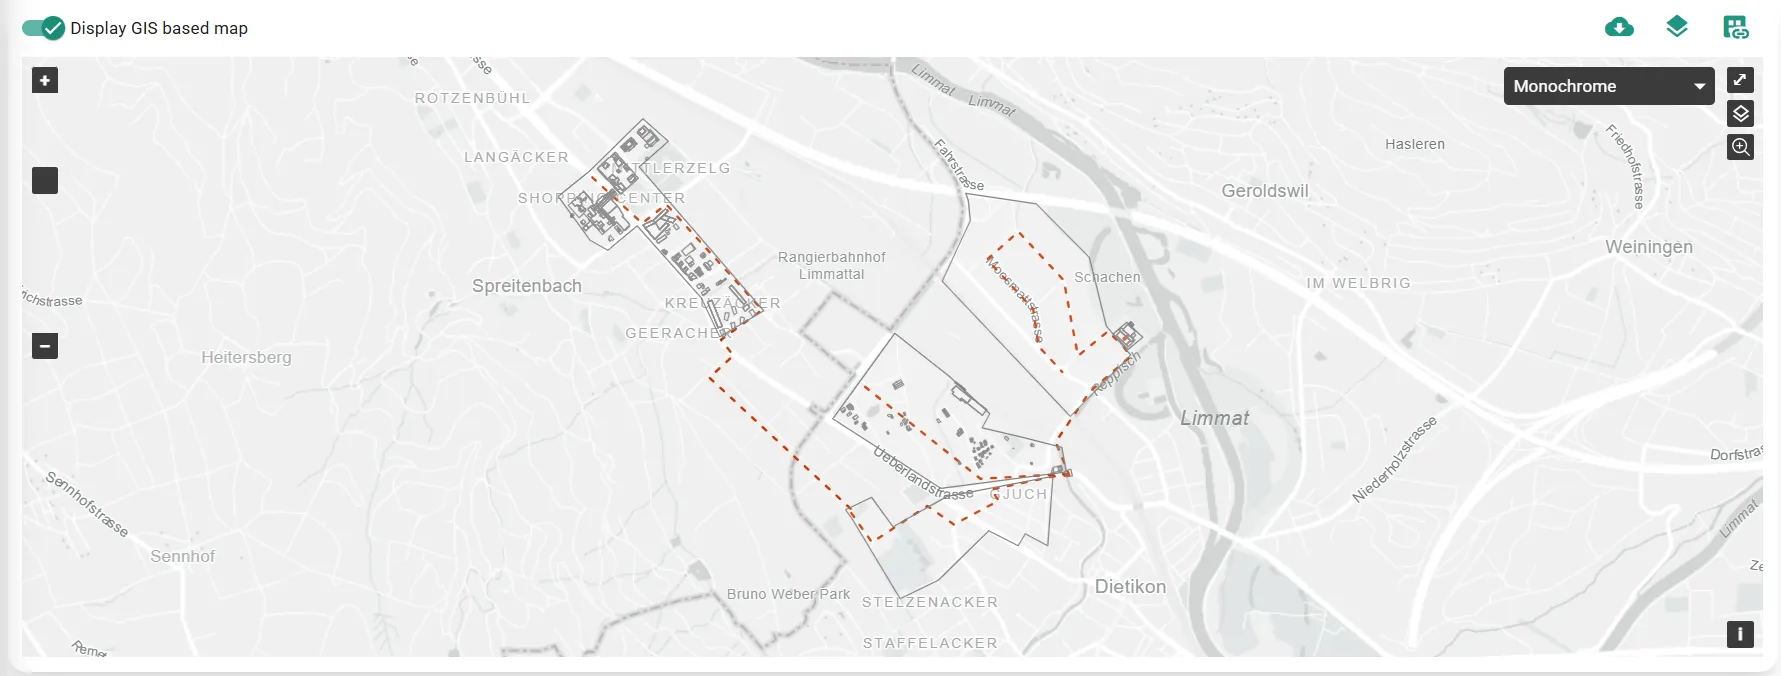
Draw hubs and candidate segments on a real GIS map. Length and routing cost are measured from the map and fed straight into the optimisation, so the engine decides which segments to build, in what order, and which to run bidirectionally, rather than you sketching one layout and costing it by hand.
- Candidate segments and hubs drawn on a GIS basemap, with CAPEX from measured length
- Build order and staging returned by the optimiser, not assumed up front
- Bidirectional operation and the connection back to an existing network modelled explicitly
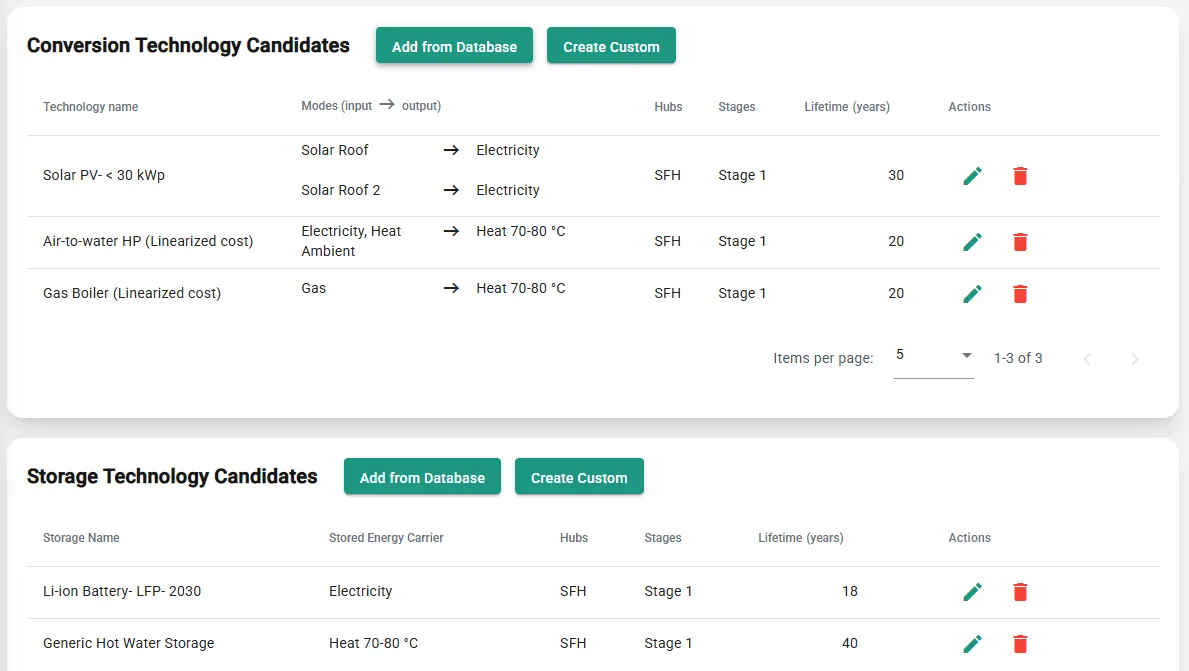
Every heat source and plant, co-optimised in the same run.
Heat pumps, waste heat recovery, biomass, gas backup, storage and existing plants all enter as candidates. Seasonal coefficient-of-performance profiles and hourly availability are built in, so the engine reflects real winter operation rather than a single annual efficiency figure.
- Heat pumps, waste heat, biomass, gas backup, storage and existing plants as candidates
- Seasonal COP and hourly resource limits respected, including river and groundwater
- Building renovation can enter as a decision variable, traded off against network sizing
Temperature regime and future scenarios, stress-tested.
Define high-temperature, low-temperature and ambient-loop options between the same hubs and let the optimisation choose. Then test the recommended system against dozens of price and demand futures, so the concept holds up when fuel costs or connection rates move.
- High-temperature, low-temperature and ambient loop compared in one project
- Sensitivity across many price and demand scenarios in the same model
- Resource and renewable-share constraints enforced hour by hour

Pareto cost-versus-CO₂ outputs stakeholders can read.
Every combination the engine evaluates lands on a Pareto front of life-cycle cost against CO₂. The cheapest scheme, the lowest-carbon scheme and the trade-offs between them come from one project, with Sankey flows, load-duration curves and the underlying data exportable to Excel.
- Pareto front across every optimised scenario, cost against carbon
- Hourly resolution across a full reference year
- Underlying data exported to Excel for the client deliverable
For the economic buyer, that means a defensible answer to the questions a board asks first: is the expansion profitable, what does it cost over its life against the reference case, and in what order should it be built.
Sympheny covers feasibility and concept design, the stage where the technology mix, network architecture and business case get settled. Detailed hydraulic design, pipe sizing, pressure and flow modelling, is a separate step in tools built for it. Most of the decisions that determine whether a heat network gets funded are made before that stage.
Built for the feasibility-to-concept decision, not the spreadsheet or the data lake.
Plenty of tools touch parts of heat network planning. Sympheny is built for the specific decision a planning team has to defend: which scheme to build, and why.
Not a single-technology calculator
Heat-pump sizing tools and solar-yield calculators answer one question well. Sympheny co-optimises the whole supply mix and the network together, so the comparison is consistent rather than stitched from separate models.
Not a long-run market model
Market and dispatch platforms model national systems over decades. Sympheny works at the district and city scale a heat network is actually planned at, with the network segments and hubs as explicit decisions.
Built around the optimisation, run in the browser
A MILP engine sits at the core, but it runs in a cloud platform an engineer uses directly, with client-ready outputs. The rigour is there without a bespoke modelling project to set it up.
Questions planners and stakeholders ask.
What is a heat network?
A heat network, also called district heating, is a system of insulated pipes that delivers heat from one or more central sources to many buildings instead of each building running its own boiler. The source can be a heat pump, waste heat, biomass, a combined heat and power plant or a mix. Sympheny models the sources, the pipe network and the demand together, so the whole system can be sized and costed as one.
How does district heating work?
Central plants heat water that circulates through buried, insulated pipes to a substation in each connected building, where a heat exchanger transfers the heat to the building's own circuit before the cooled water returns to be reheated. How hot the network runs, the temperature regime, drives both efficiency and which sources can supply it. That regime is one of the choices Sympheny's optimisation engine resolves rather than fixing up front.
What is a district heating feasibility study?
A feasibility study tests whether a heat network is technically workable and financially viable before any capital is committed: what to supply it with, how to route it, what it costs over its life and how much carbon it saves. Sympheny is built for this stage, comparing supply options and network architectures on cost against CO₂ in one model and producing outputs a funder or authority can interrogate.
How much does a heat network cost?
Cost depends on the heat density of the area, the route length, the temperature regime and the supply mix, so a credible figure comes from modelling the specific scheme rather than a rule of thumb. Sympheny measures network length from the GIS map, calculates CAPEX from it and returns life-cycle cost for each scenario, so options are compared on the same basis. On the Primeo Muttenz expansion, three of four scenarios were profitable once the network and supply were optimised together.
How do you plan a heat network?
Planning runs from heat demand and density, through candidate supply sources and network routes, to a costed concept and a build order. The hard part is that those choices interact, so deciding them one at a time tends to lock in a sub-optimal design. Sympheny co-optimises the network segments, supply technologies, connection timing and renovation in one run at hourly resolution, then stress-tests the result across many futures.
How does Sympheny help with heat network planning?
Sympheny is a cloud-based multi-energy optimisation platform that compares heat sources, network architectures and costs for a heat network in a single feasibility model. It returns a Pareto front of cost against CO₂, sized technologies, the network segments to build and a staged order, with the underlying data exportable for the client deliverable. Engineering firms, utilities and municipalities use it to move from a site brief to a defensible concept in days rather than weeks.
Related pages and proof.
See your heat network options compared before you commit.
Bring a scheme to a demo and watch the network, the supply mix and the costs resolved in one model, or start a free trial and build the first concept yourself.