Plan the net-zero pathway your board, regulator, and customers can stand behind.
Net-zero by 2050 means real CAPEX decisions in this planning cycle: district heating growth, grid reinforcement, sector coupling, and a generation mix that holds up under regulator and customer scrutiny. Sympheny gives utility planning teams one model to compare those pathways side by side, with cost, CO₂, and supply-security trade-offs visible from day one.
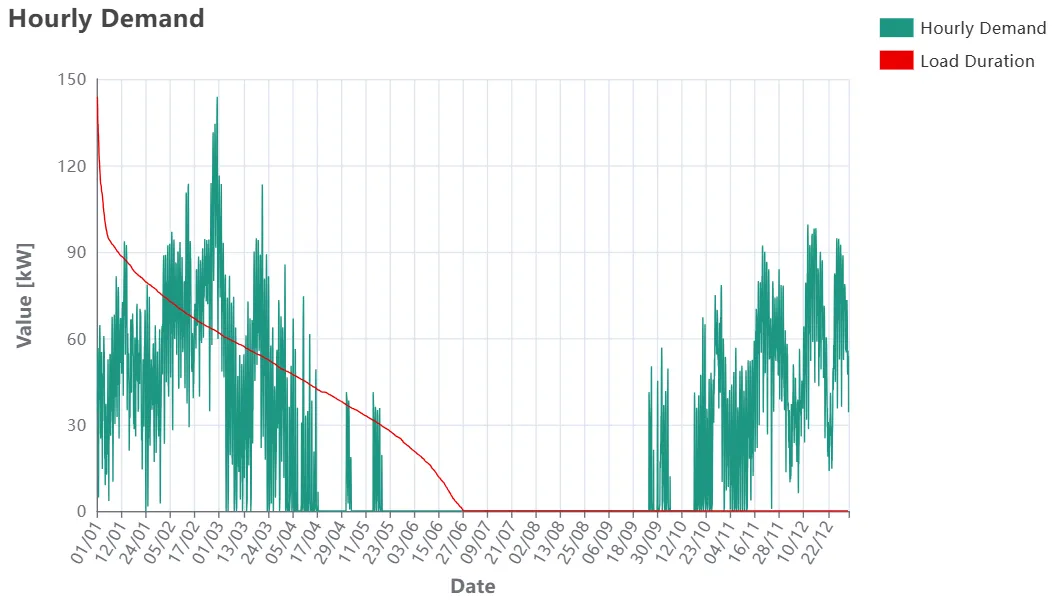
Hourly heating demand with load-duration curve: full-year resolution for a 1,000 m² residential building.
Trusted by utility and grid planning teams
Used by Swiss and European utilities to plan district heating expansion, generation strategy, and city-wide supply pathways toward 2050.


How Sympheny helps
One model for every supply pathway
Compare district heating, electrification, sector coupling, and generation mix scenarios on the same baseline, not as separate studies stitched together at the end.
CAPEX and CO₂ trade-offs visible early
Quantify the investment implications of each pathway before committing, so the board, the regulator, and the customer base see the same evidence base.
A planning asset, not a one-off study
When tariffs, demand forecasts, or policy assumptions move, re-run scenarios in the same workflow instead of restarting from a blank sheet.
What changes for utilities and grid planners
| Process | Before Sympheny | With Sympheny |
|---|---|---|
| Network and supply planning | Each district, network, and supply option lives in its own study, hard to compare and harder to defend | One structured model compares long-term supply, DH and grid scenarios side by side on the same baseline |
| Infrastructure investment case | CAPEX, OPEX and CO₂ trade-offs are difficult to quantify before the board commits | Scenario outputs make the life-cycle cost and emissions implications of each pathway visible early |
| Regulatory and market change | Tariff, demand, or policy shifts trigger weeks of manual rework | Update assumptions once and re-run scenarios in the same workflow. The planning asset evolves with the system |
| Net-zero roadmap | A static study delivered to the board and outdated by the next planning cycle | A living roadmap the team owns, re-runs, and uses to brief the regulator and customers |
How IBC Chur built a defensible net-zero pathway for the city.
“Digitalization with Sympheny helps us to develop decentralized energy concepts and creates security for investments in new infrastructures.”
— Martin Derungs, CEO, IBC Chur Read the full IBC Chur case study →
Utility planning, proven in the field.
See how utilities have used Sympheny when the board wants one investment roadmap, not a folder of studies, and the regulator wants to see the cost and emissions behind it.
City-wide energy supply strategy toward 2050
Technical proof: 3.2 M m2 energy reference area, three time horizons modelled
Business outcome: CO2-free 2035 supply confirmed at similar life-cycle cost.
Optimal expansion strategy for a district heating network
Technical proof: Five network segments included in the optimal design
Business outcome: Three of four expansion scenarios confirmed profitable.
Solar development strategy for the Port of Switzerland
Technical proof: 16 variants across four strategies optimised
Business outcome: Up to 20-25% cost reduction identified; lowest-risk path confirmed.