One model for behind-the-meter generation, microgrids and thermal energy networks.
Interconnection queues run for years and AI load keeps climbing. Sympheny optimizes on-site generation, storage, microgrids and thermal networks together, so you can size what a site actually needs and back the numbers before any capital is committed. Every scenario is solved with mixed-integer linear optimization, so the recommendation rests on the math, not on rules of thumb.
Swiss company · 70+ customers across Europe, the US and China · US enterprise deployment options · Your data stays yours


The constraint isn't efficiency anymore. It's getting power.
New loads wait years for a grid connection while demand keeps rising. Behind-the-meter generation, microgrids and thermal energy networks are how a data center, campus or federal site moves forward, and they only pencil out if the whole system is optimized together rather than as separate studies. That is the job this software does.
Interconnection queues run for years
Large new loads wait years for a grid connection, and some are told there is no capacity to give. The way through is behind-the-meter generation and a smaller, better-evidenced grid request, sized against the real load.
AI load is climbing and it swings hard
Data-center demand is projected to grow several-fold this decade, and AI workloads move sharply through the day. A system sized on a flat average is wrong for operation and wrong for the connection study.
Behind-the-meter carries the gap
On-site generation, storage and a microgrid keep a site moving while the grid catches up. Sized against real hourly load they are bankable; sized on a nameplate number they are not.
Thermal energy networks decarbonize campuses
Campuses, bases and data-center districts are moving heating and cooling onto shared ambient loops and heat pumps. The feasibility case has to compare options on cost and carbon, defensibly.
From a site brief to a defensible, optimized concept.
Pull the buildings, demand and constraints into one digital twin, let the engine find the lowest-cost or lowest-carbon system across thousands of options, then read the result as energy flows you can put in front of the people who sign off on it.
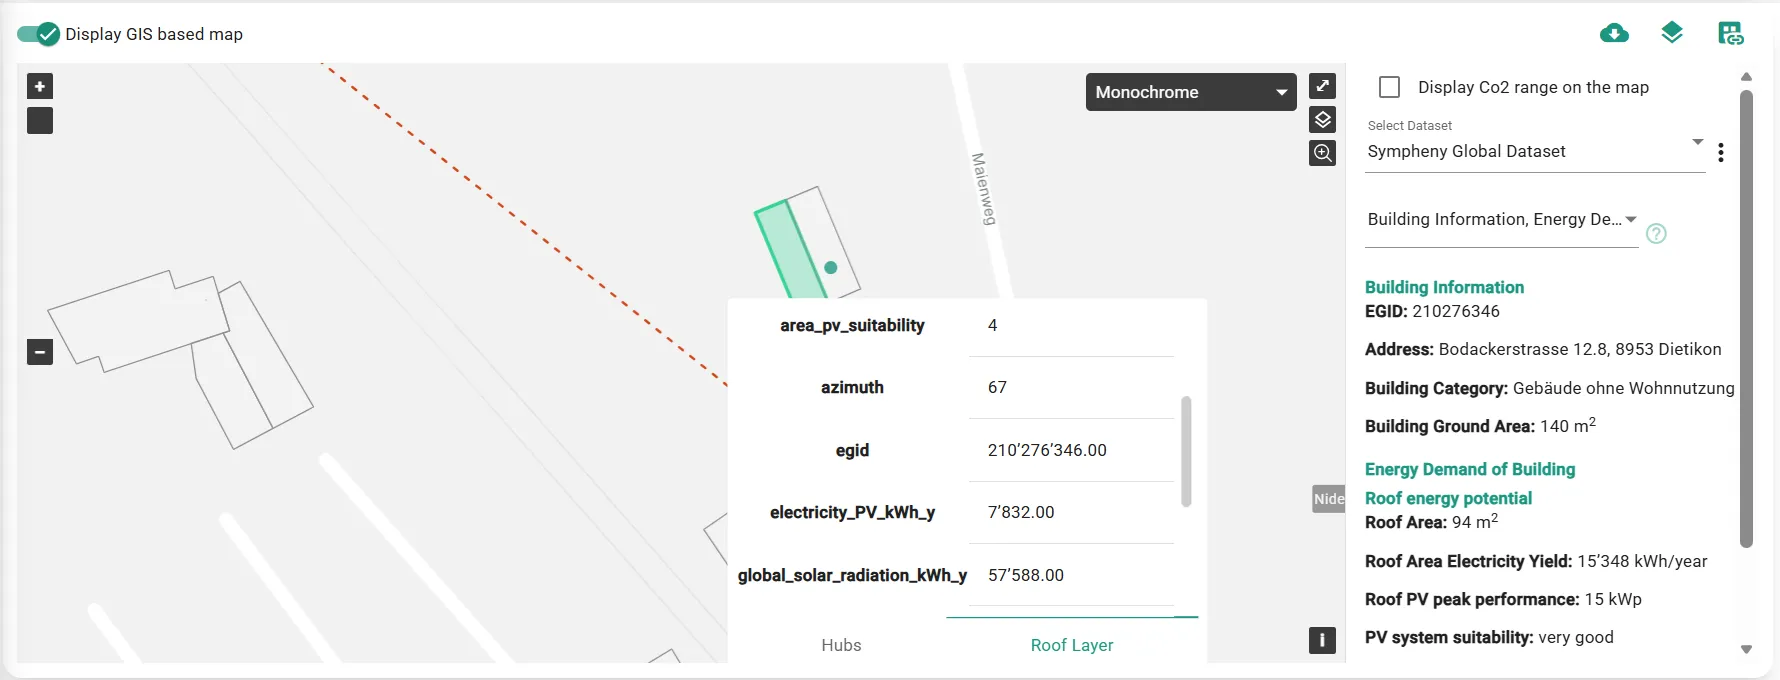

Build the data foundation once.
Asset catalogs, hourly demand profiles, tariffs, weather data, GIS layers and meter data sit in a single project you can reuse. The model carries the assumptions, so a reviewer can trace any number back to where it came from.
- Hourly load profiles for power, heat and cooling
- Weather and irradiance data for on-site generation
- Capex, opex and tariff assumptions in one place
- CO2 factors per energy carrier
The point isn't more inputs. It's a model where every output is traceable to an assumption you can defend.
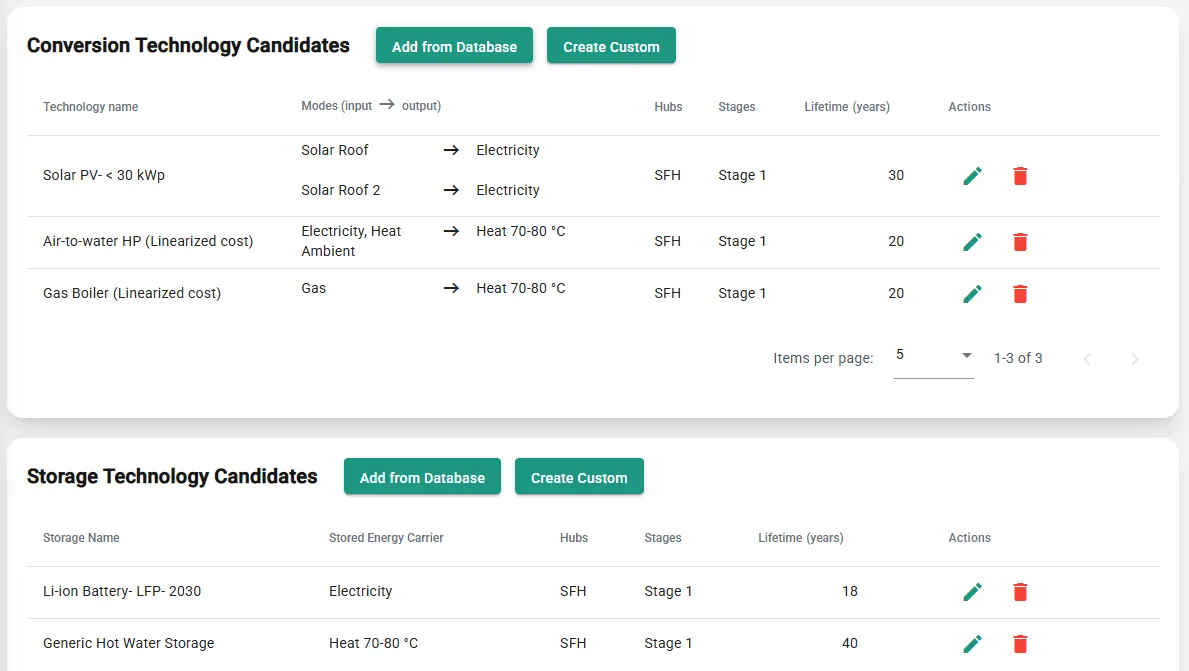
Optimize the whole system, not one slice.
The engine sizes generation, storage and networks against the real hourly load and the grid constraints at the same time. Behind-the-meter, microgrid and sector-coupling options get compared on the same footing, so the answer reflects how the site will actually run.
- Thermal and electrical networks modeled together
- Hourly simulation across a full reference year
- Peak load and grid-request sizing
- Capacity and dispatch optimized in one solve
A system sized on a flat average is wrong for operation and wrong for the connection study. Hourly resolution is the difference.

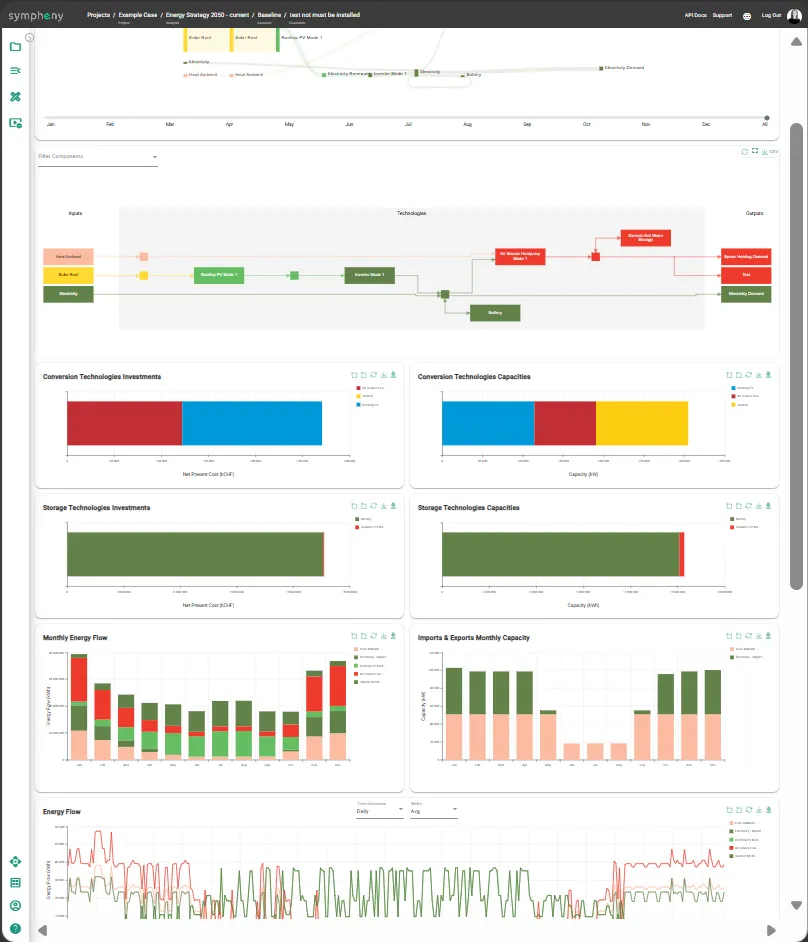
Outputs a funder, tenant or reviewer can actually read.
Every chart is generated from the same model and viewable in the app, so the study survives the review where someone picks it apart instead of falling over the first time it's questioned.
- Hourly demand profiles and load-duration curves across a full reference year
- Sankey energy flows showing how power, heat and cooling move through the system
- Pareto cost vs. CO2 comparison across every optimized scenario
- Outputs viewable in the app and exportable for a stakeholder review
An optimization engine, not an AI guess.
The work that matters happens in a deterministic solver. That is what lets a US developer, A&E firm or federal program defend the system in a room full of people whose job is to find the hole in it.
Deterministic MILP, not a black box
Every scenario is solved as a mixed-integer linear program. Given the same inputs you get the same answer, with the constraints written down. That matters when a funder, a tenant or a federal reviewer wants to see why the system was sized the way it was.
Multi-energy by design
Electricity, heat, cooling, gas, hydrogen, storage and on-site generation are optimized together inside one model, so behind-the-meter and sector-coupling choices are judged as part of the same system rather than in separate studies that never line up.
Site to district scale
Start with one building and grow to a campus or a data-center district without rebuilding the model. GIS context, hourly demand, tariffs and asset assumptions stay in one reusable workspace.
Built on a decade of research
Sympheny is an Empa spin-off out of the ETH Domain with more than ten years of R&D behind the optimization approach. The method is published, and the platform is the practical wrapper around it.
The optimization is pure math — no AI is used to size the system. Read how the method works in our research, or see the modeling approach in detail.
Proven on the same problems US sites face.
These are European commissions. They demonstrate the method a US data center, campus or base relies on: needing less from the grid by generating, storing and sharing on site, with the numbers documented well enough to defend. In the US, Sympheny's optimization engine has been applied in Department of Defense thermal energy network feasibility studies under the ESTCP program.
A two-site system sharing a thermal network and a microgrid, with life-cycle cost up to 26% below the baseline and six Pareto variants compared in under ten minutes.
Read case studySixteen on-site generation and energy-sharing scenarios compared in one project. Interlinking buildings to generate and share power locally came out the lowest-risk strategy.
Read case studyA low-temperature thermal network moving 90,000 MWh a year of heating and cooling across six hubs and 30+ scenarios — the ambient-loop problem a campus TEN poses.
Read case studyThe European projects above are used as capability proof of the method, not as claims of US deployments.
“With Sympheny I compared far more energy-system variants in my project work than would ever have been possible by hand in Excel. And for each variant I could see straight away what it meant technically, in energy terms, and economically.”
“Sympheny builds charts on cost, CO₂ emissions and performance on its own, and fast. Excel isn't that quick. And you can download the output file directly and keep working with it in Excel. An excellent program when you want to compare several energy solutions at once.”
Watch the platform do the work.
Scenario setup, optimization and reporting in one workflow, and a result read as energy flows.
Platform overview
From a site brief to compared scenarios — the end-to-end planning workflow in one short walkthrough.
Energy flows, visualized
How an optimized result reads as a Sankey diagram — supply, conversion, storage and demand at a glance.
Bring us a site the grid can't power yet.
We'll model the on-site generation, the storage, the network and the grid cost together, and show you the system worth building before anyone specifies a component.