What connects to Sympheny.
Sympheny fits the data and reporting workflow a US planning team already uses. On the way in, it brings in standard US public datasets: NREL solar and building load data, EIA prices, eGRID emissions factors, NOAA weather and the OpenEI Utility Rate Database. On the way out, you get in-app dashboards and a REST API. Because those federal sources are free, a US team can build a model on authoritative data at no extra cost.


Bring authoritative US data into every project
Sympheny works with the standard US public datasets a planning team already trusts, so you start a model from real solar, load, tariff and emissions data instead of rebuilding it in spreadsheets. These federal sources are free to access, so a US team can pull authoritative inputs at no cost and override anything per project.
NREL solar, PV and building load data
Bring in standard NREL datasets: NSRDB solar resource data for irradiation, PVWatts for PV yield, and ResStock / ComStock load profiles for residential and commercial buildings. NREL data is free; programmatic access uses a free NREL Developer API key.
Learn moreEIA prices and generation data
Works with US Energy Information Administration data: electricity prices and tariffs, fuel prices, and generation data, so cost assumptions reflect your region. EIA data is free and in the public domain.
Learn moreeGRID grid emissions factors
Pulls in EPA eGRID regional emissions factors so the carbon side of a scenario is grounded in the grid your site actually sits on, not a national average. eGRID is free and in the public domain.
Learn moreNOAA weather and climate data
Works with NOAA weather and climate reference data to drive hourly simulations across a representative year. NOAA data is free and in the public domain.
Learn moreOpenEI Utility Rate Database (URDB)
Brings in tariff structures from the OpenEI Utility Rate Database, which covers 3,700+ US utilities and is maintained by NREL, so a model can reflect real rate schedules. URDB is free and openly licensed.
Learn moreEsri ArcGIS
Use ArcGIS layers and basemaps for site context, building footprints and district boundaries inside the project workspace. ArcGIS is licensed separately by your team; Sympheny works with the layers you bring.
Learn moreYour own asset, demand, tariff and cost data
Import your own hourly demand, metered consumption, technology assumptions and capex/opex figures from CSV and standard formats. Project-specific numbers always override the public defaults.
Hand off results in the formats stakeholders use
The same model that runs the optimization produces the visuals, comparisons and reports your stakeholders see. No rebuilding charts in a slide deck before a review board.
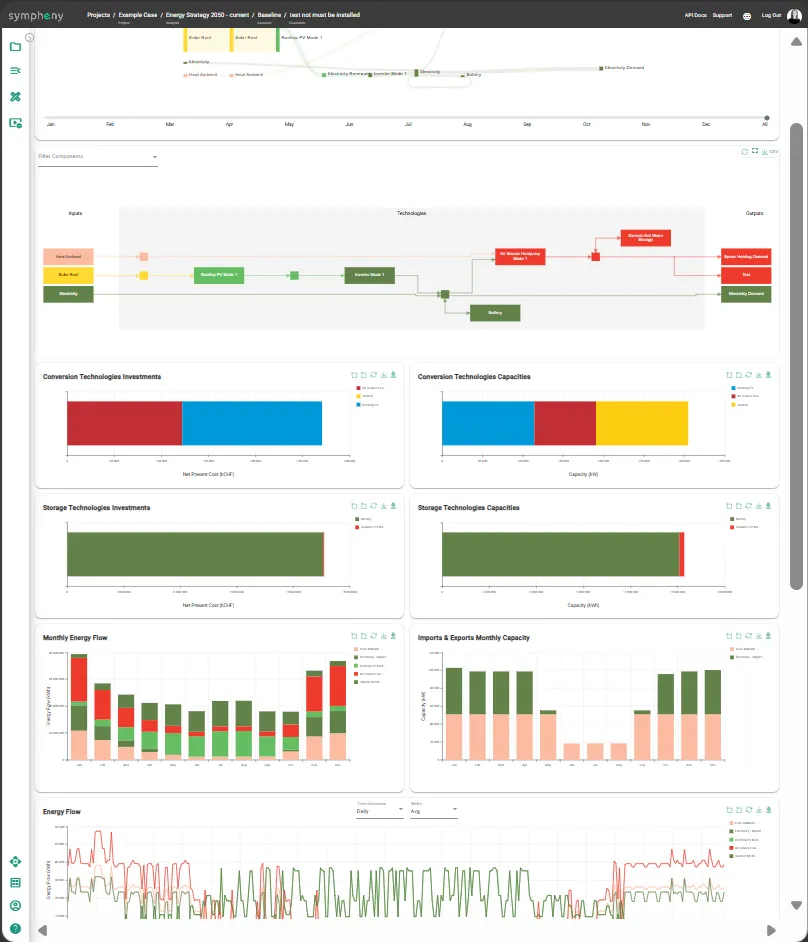
In-app reports
Run outputs — assumptions, scenario comparison, KPIs and energy-flow diagrams — viewable directly in the project workspace and printable from the browser.

Sankey energy flows
Sankey diagrams showing energy flows from sources through conversion to final demand, viewable in the app.

Pareto scenario comparison
Every optimized scenario plotted on cost vs. CO2 in one chart, so the trade-off curve is visible at a glance.
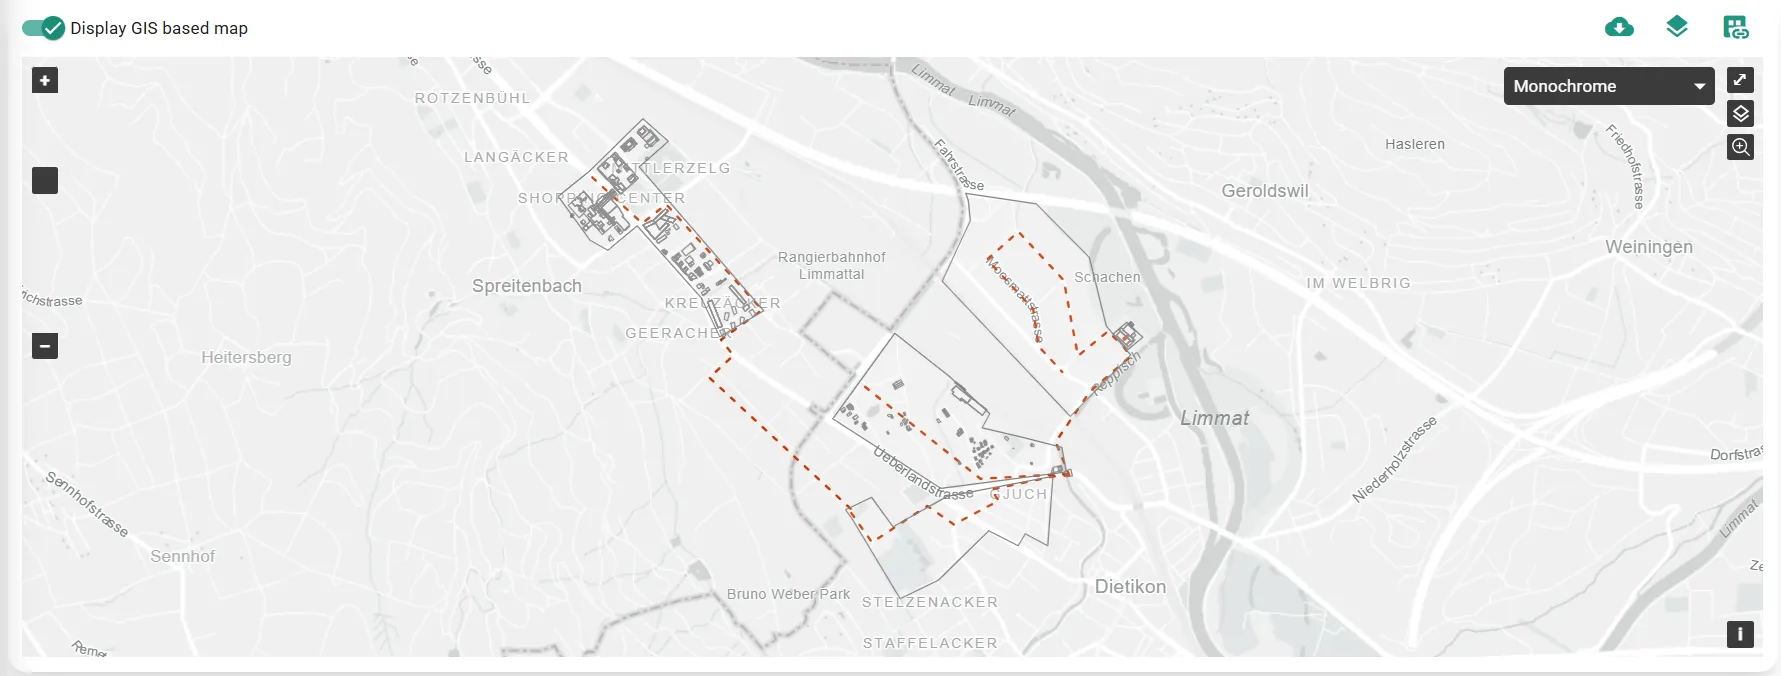
GIS hub views
Map-based views of energy hubs in their geographic context for stakeholder review and public communication.

Image & SVG exports
Charts, GIS views and Sankey diagrams export as image or vector files for direct use in presentations and slides.
See Sympheny in your stack.
Book a 30-minute live demo and we'll walk through how Sympheny fits with the US data and tools your team already uses.