The story
Riverside Logistics Park is a fictional site with five companies: a container terminal, a cold store, a food processor, a warehouse, and an office and workshop. Between them they use about 3,150 MWh of electricity a year, and they heat with gas.
The roofs could carry a lot of solar. The warehouse roof is by far the biggest, but the warehouse itself uses very little power.
So there are three questions. Where does solar actually pay? Should the companies share their solar power, with their own cables or through a local electricity community? And what does that do to cost and CO₂?
To answer them, you build one scenario with each company on its own, then copy it three times: a baseline with grid power and gas only, a version with private cables, and a version with a local electricity community. All site data, loads and prices are invented for this example.
Step by step
Follow along in Sympheny. Each step has a screenshot from the video; click the time under it to watch that moment.
- 1
Create the project
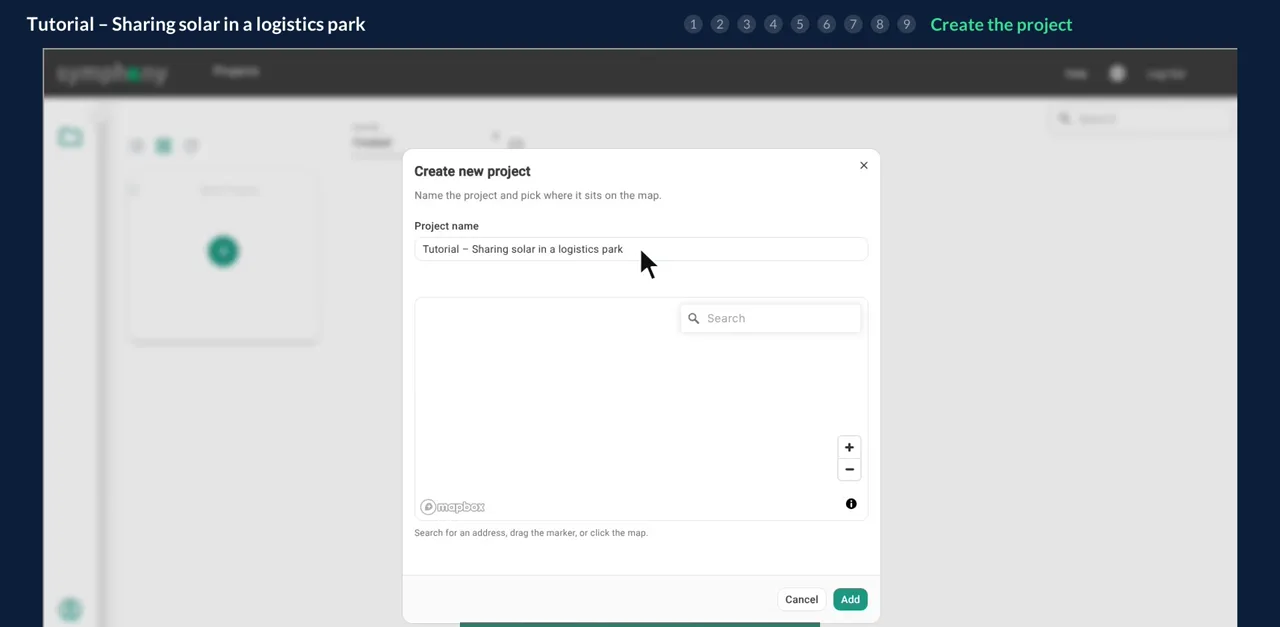
On the Projects page, click the plus, give the project a name and click the map to set its location. Add a picture so the project is easy to find later.
In the first analysis, add a scenario and call it “1 - Each company on its own”. This is the scenario you build step by step; the other three are copies of it.
In the documentation: Projects ↗
- 2
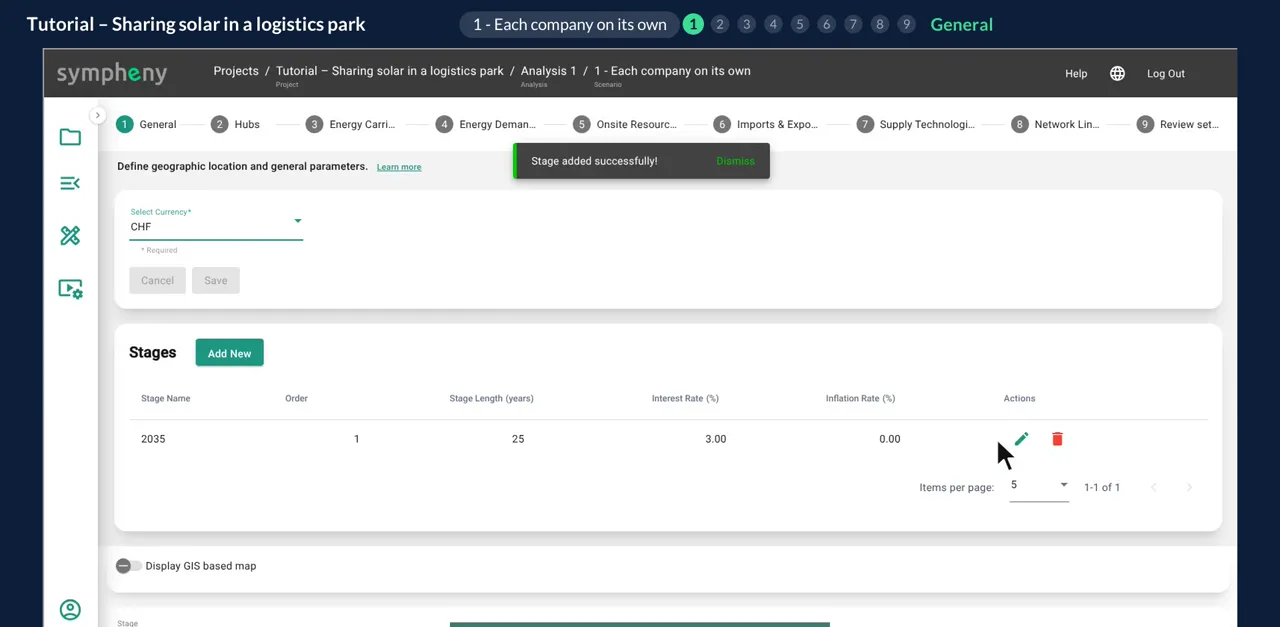
Step 1, General: currency and stage
Select CHF as the currency. Add one stage called 2035 with a length of 25 years, an interest rate of 3 % and an inflation rate of 0 %, so all costs are in real terms.
In the documentation: General step ↗ Stages ↗
- 3
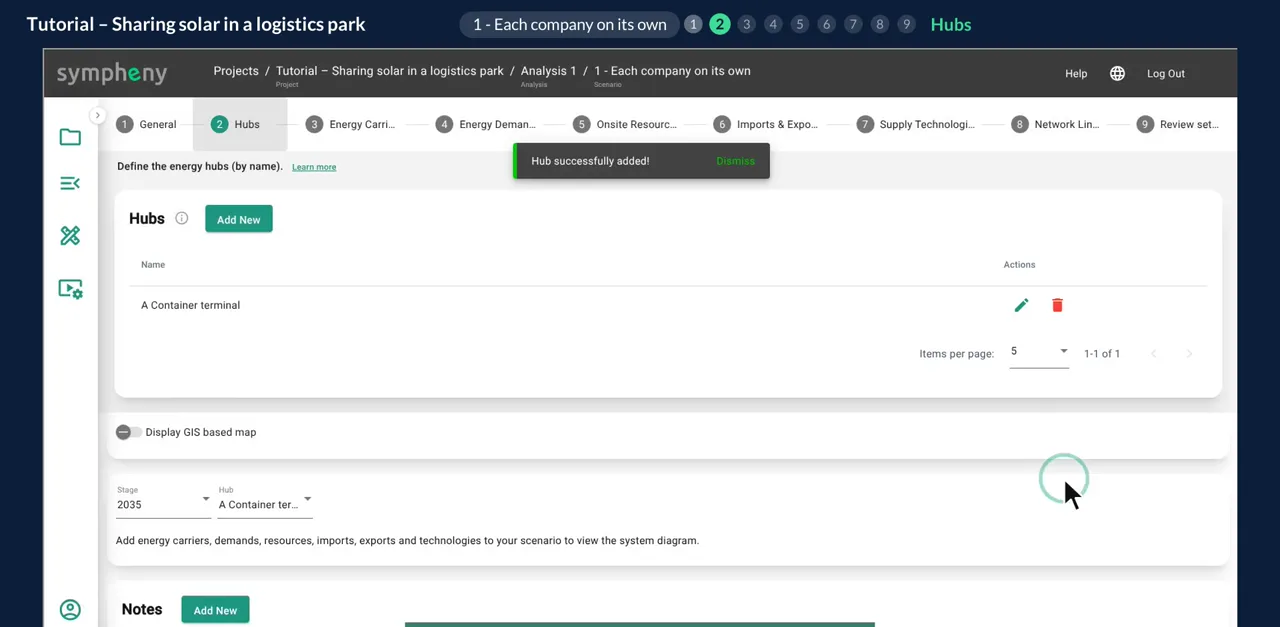
Step 2, Hubs: one per company
Add a hub for each company: A Container terminal, B Cold store, C Food processor, D Warehouse and E Office and workshop.
Giving each company its own hub lets Sympheny optimise them separately, and later connect them with network links.
In the documentation: Hubs step ↗
- 4
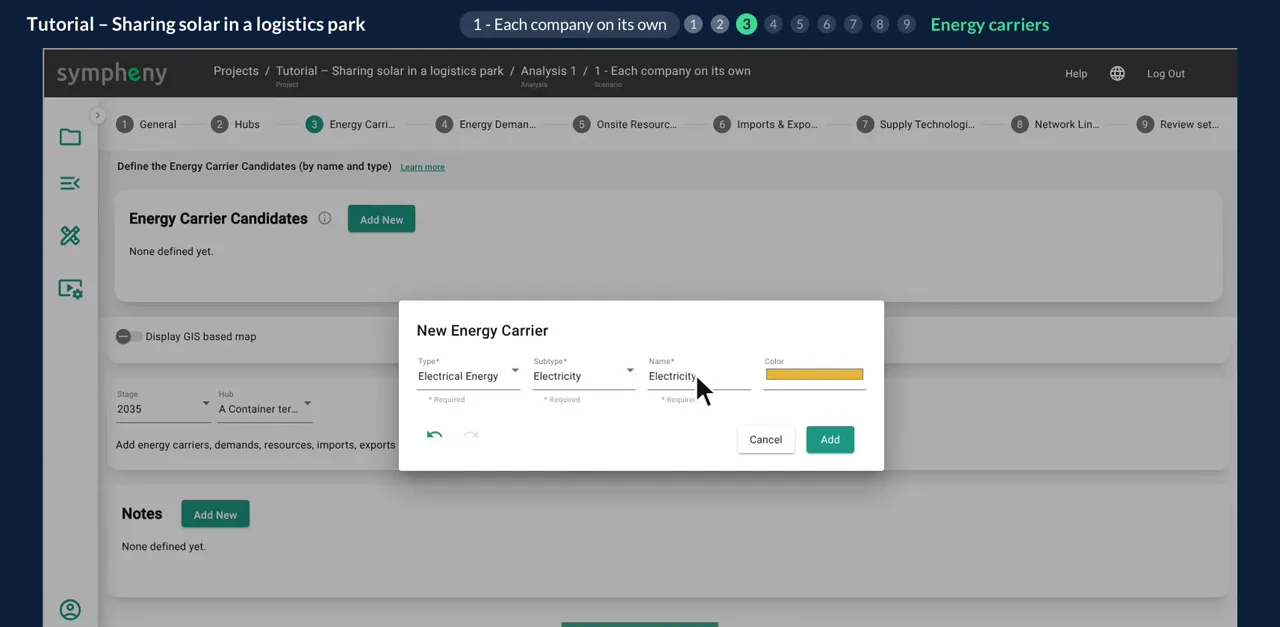
Step 3, Energy Carriers
You need four energy carriers: Electricity, Heat 50-60 °C, Gas, and Solar Roof, the solar resource on the roofs.
In the documentation: Energy carriers step ↗
- 5
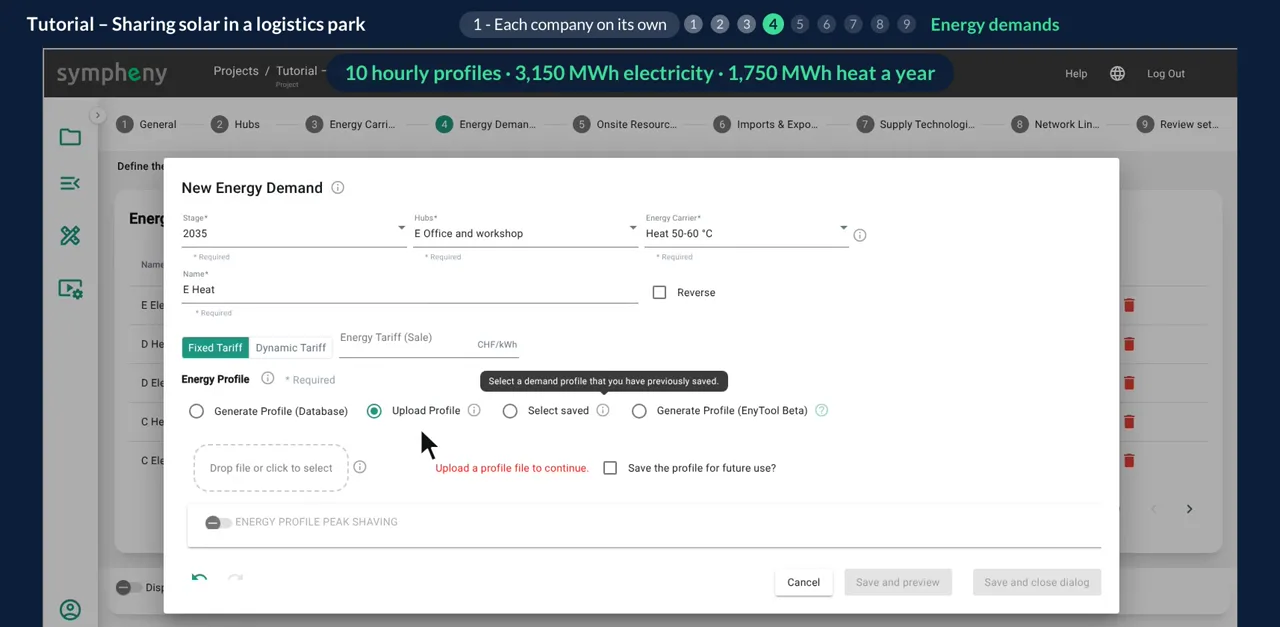
Step 4, Energy Demands
Each company gets an hourly electricity profile and an hourly heat profile. For this example we prepared them: ten profiles in total, 3,150 MWh of electricity and 1,750 MWh of heat a year across the site.
In your own project, upload metered data or generate profiles from the database.
In the documentation: Energy demands step ↗
- 6
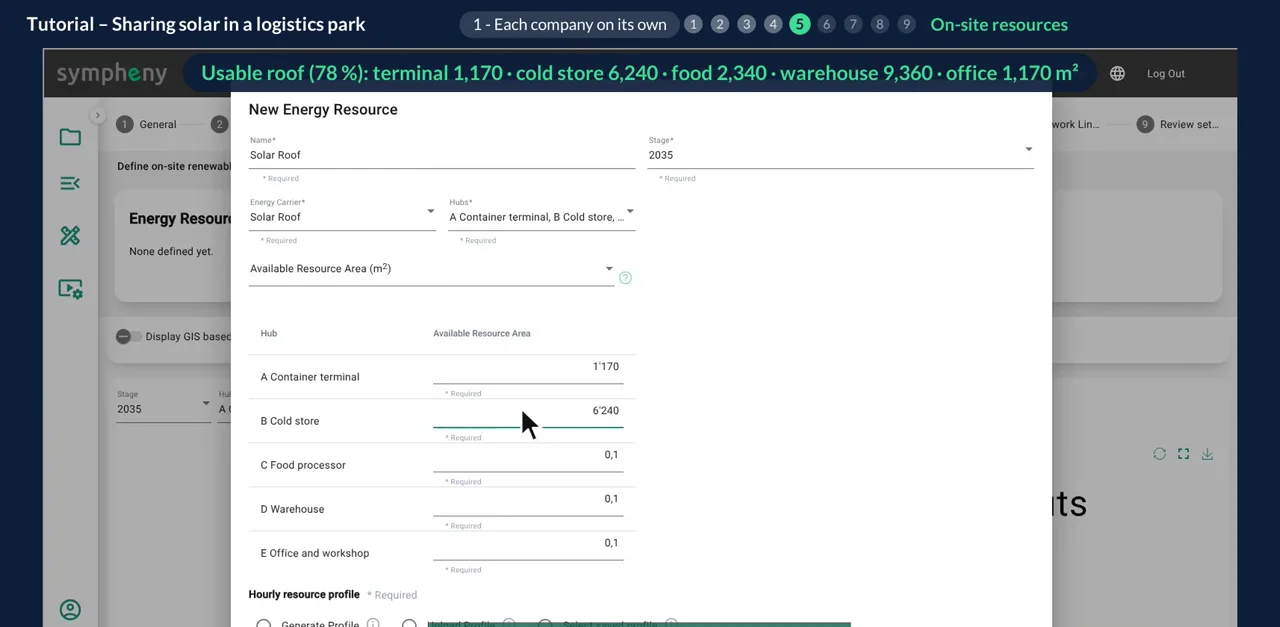
Step 5, Onsite Resources: usable roof area
Add the Solar Roof resource and enter each roof's usable area. Here it is 78 % of each roof: container terminal 1,170 m², cold store 6,240 m², food processor 2,340 m², warehouse 9,360 m² and office 1,170 m².
The warehouse has by far the biggest roof, but it uses the least electricity. Keep an eye on it in the results.
In the documentation: On-site resources step ↗
- 7
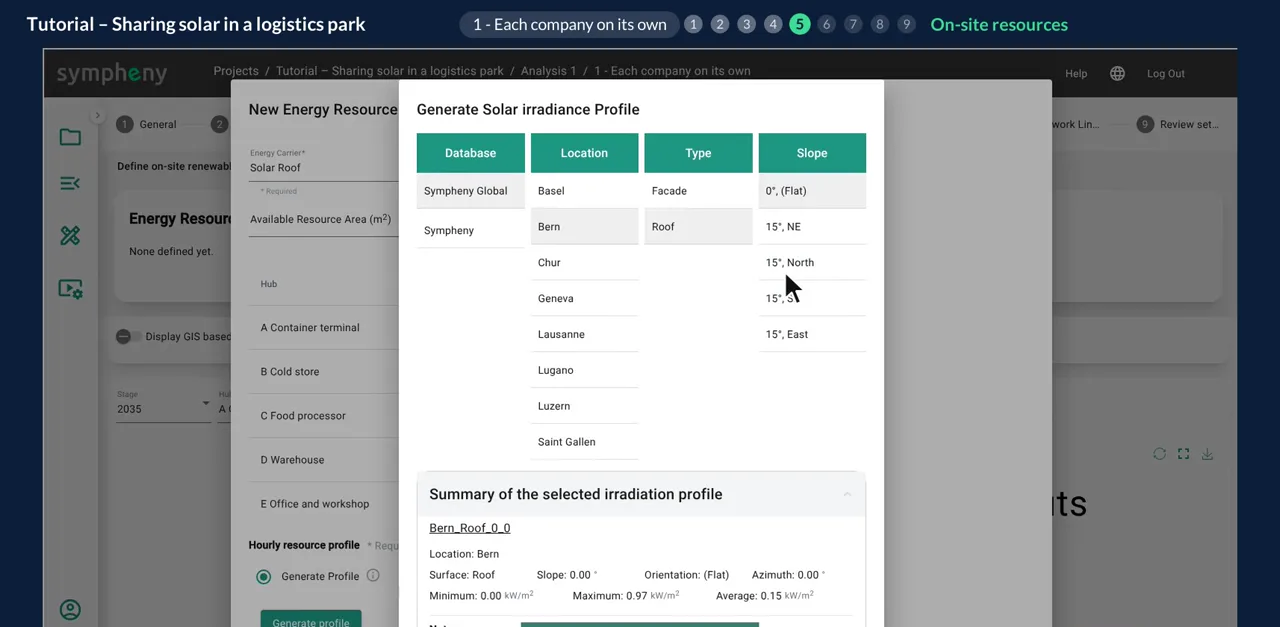
Generate the irradiance profile
Under Hourly resource profile, choose Generate Profile and pick a profile from the database: Bern, Roof, 0° (Flat). The summary shows the selected profile, Bern_Roof_0_0.
In the documentation: On-site resources step ↗
- 8
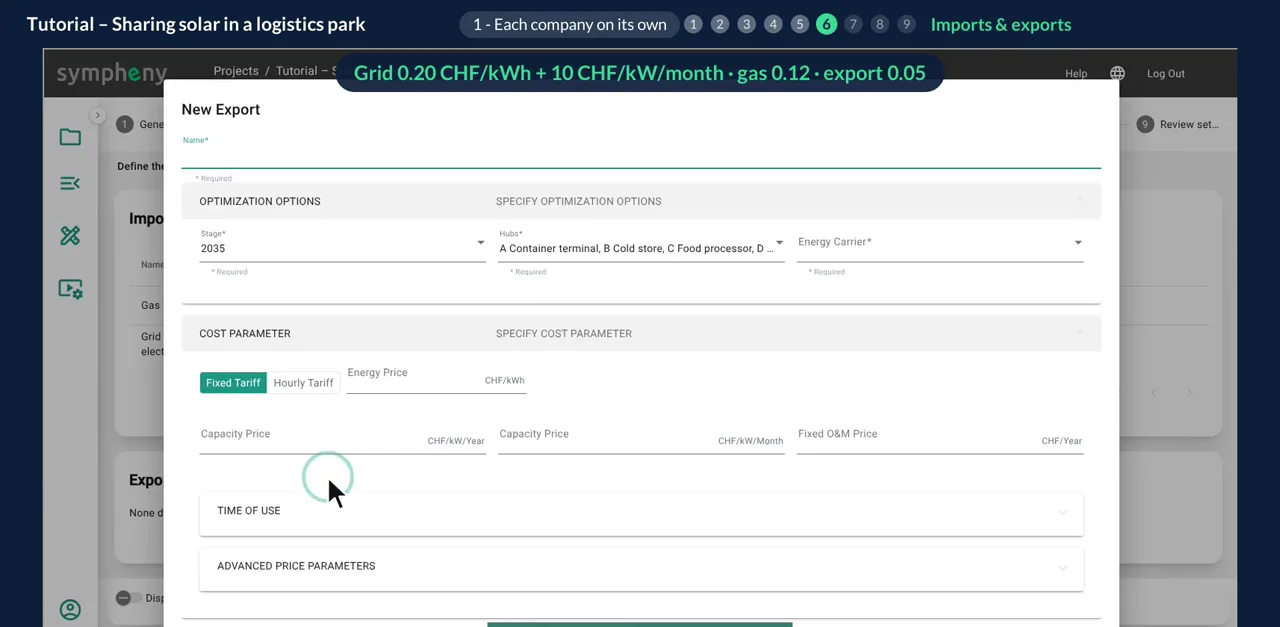
Step 6, Imports & Exports
Grid electricity costs 0.20 CHF/kWh plus a capacity price of 10 CHF/kW per month. Every company keeps its own grid connection, so each pays its own capacity charge.
Gas costs 0.12 CHF/kWh. Add an export so surplus solar can be sold back at 0.05 CHF/kWh.
For CO₂ we use illustrative operational factors: 0.125 kg/kWh for grid electricity and 0.202 kg/kWh for gas. Exported solar gets no CO₂ credit.
In the documentation: Imports & exports step ↗
- 9
Step 7, Supply Technologies: rooftop solar
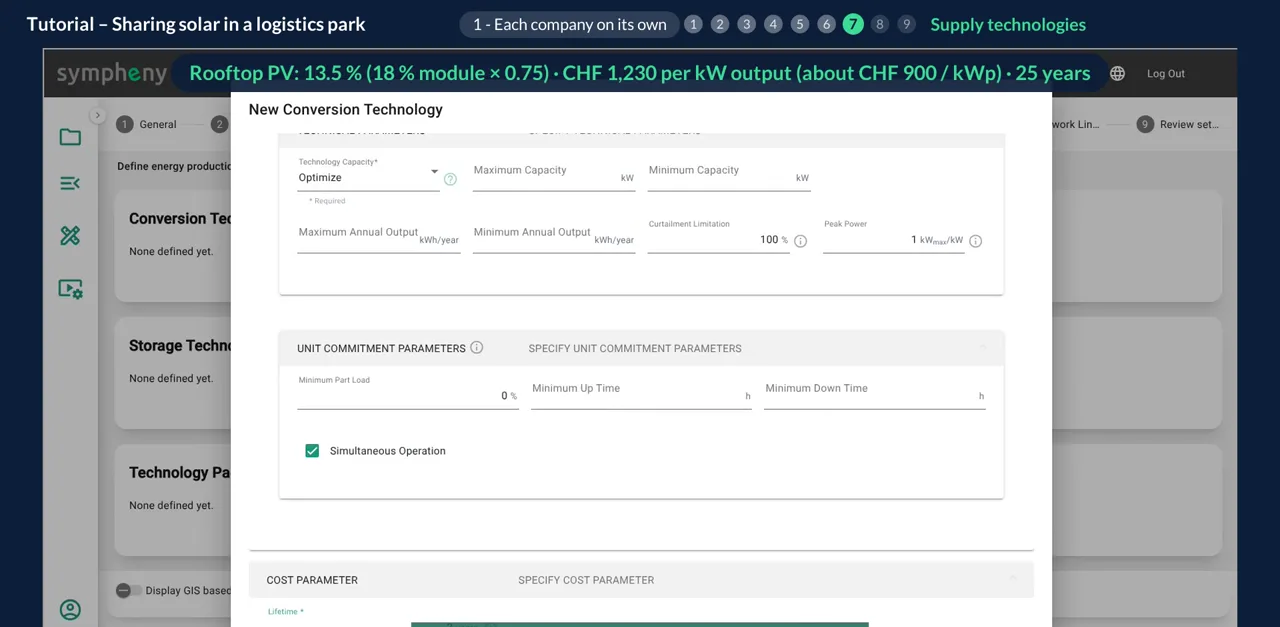
Add Rooftop PV, converting Solar Roof into Electricity. Its efficiency is 13.5 %, which is an 18 % module times a 0.75 performance ratio, applied to the sunlight on the usable roof.
Leave the capacity on Optimize so Sympheny decides how much to build on each roof. Investment is CHF 1,230 per kW of output, which is about CHF 900 per kWp, with 20 CHF/kW a year for operation and maintenance and a 25-year lifetime.
In the documentation: Supply technologies step ↗
- 10
Heat pump and existing gas boilers
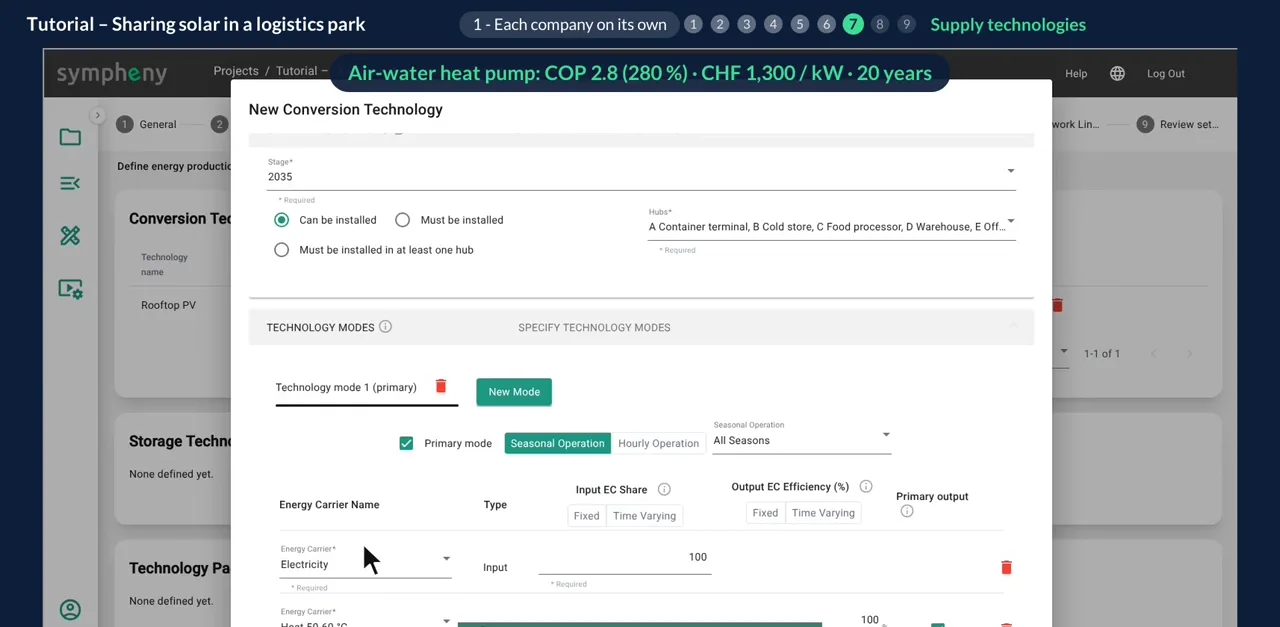
Add an air-water heat pump in every hub: one unit of electricity gives 2.8 units of heat (an output efficiency of 280 %). It costs CHF 1,300 per kW and lasts 20 years.
The gas boilers already exist, so they have no investment cost. Enter them with 92 % efficiency, and Sympheny can keep using them where that is the better choice.
In the documentation: Supply technologies step ↗
- 11
Step 8, Network Links: none yet
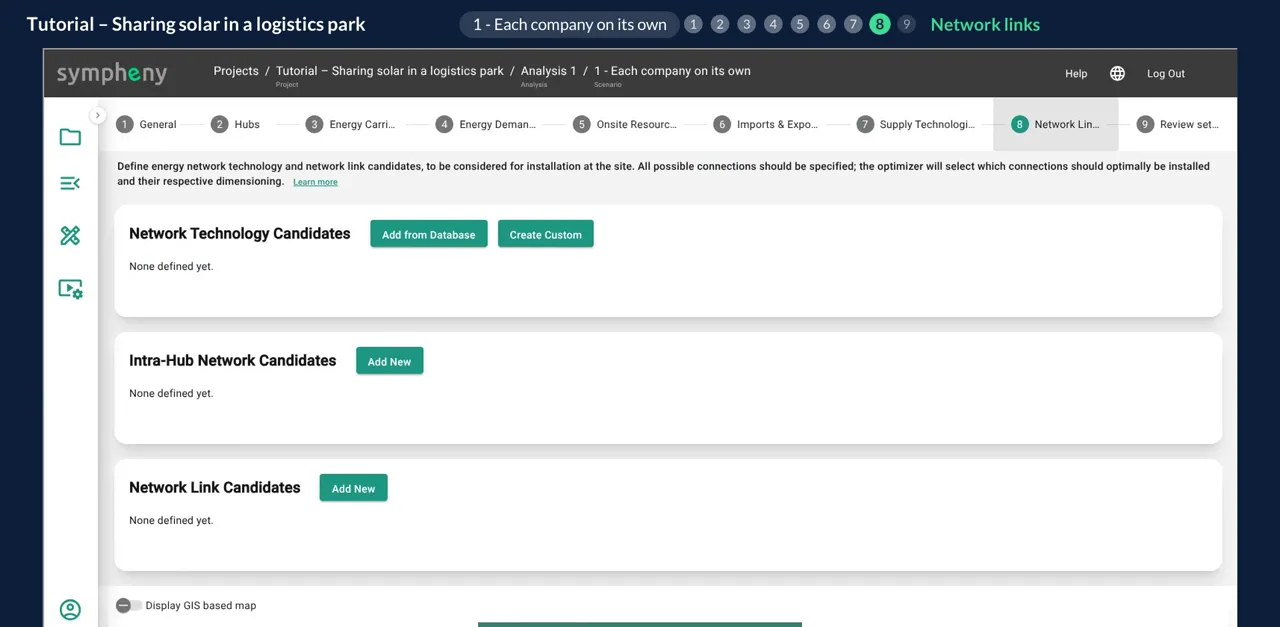
Leave the Network Links step empty: in this scenario each company is on its own. You'll run it later, together with the other scenarios.
In the documentation: Network links step ↗
- 12
Copy the scenario: the baseline
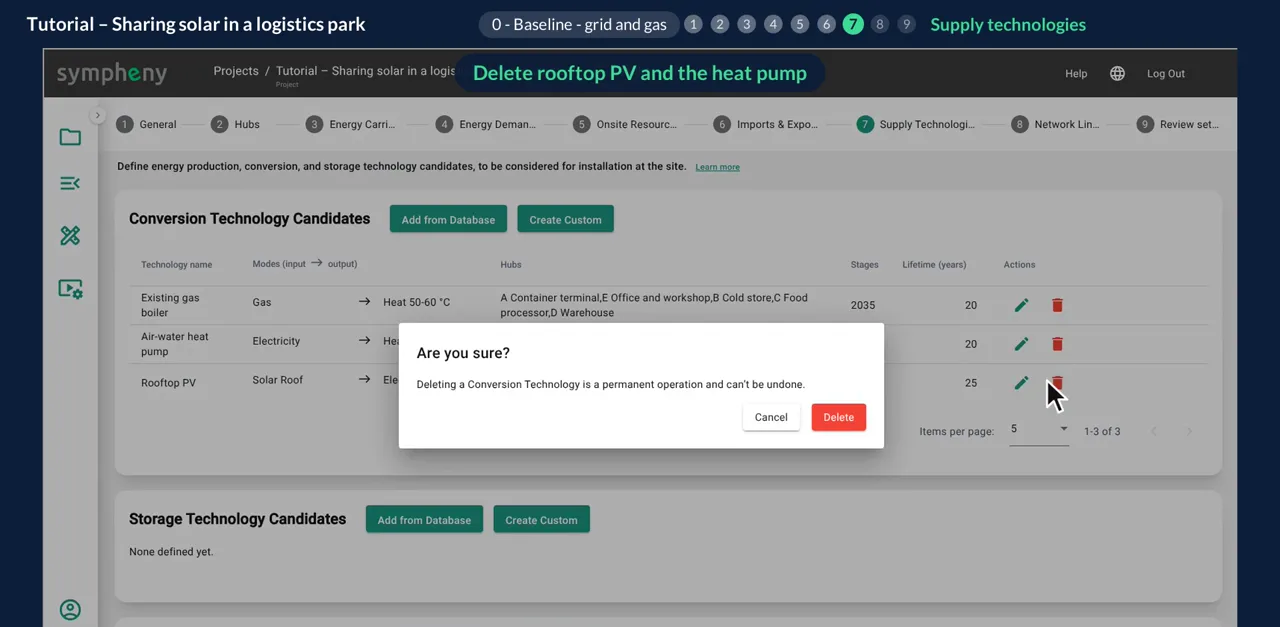
For a reference, copy the scenario and name the copy “0 - Baseline - grid and gas”. In Supply technologies, delete Rooftop PV and the heat pump, so the baseline buys all its electricity from the grid and heats with gas.
In the documentation: Analyses and scenarios ↗
- 13
Copy again: private cables
The first way to share solar is a private cable. Copy scenario 1 and name it “2 - Private cables”.
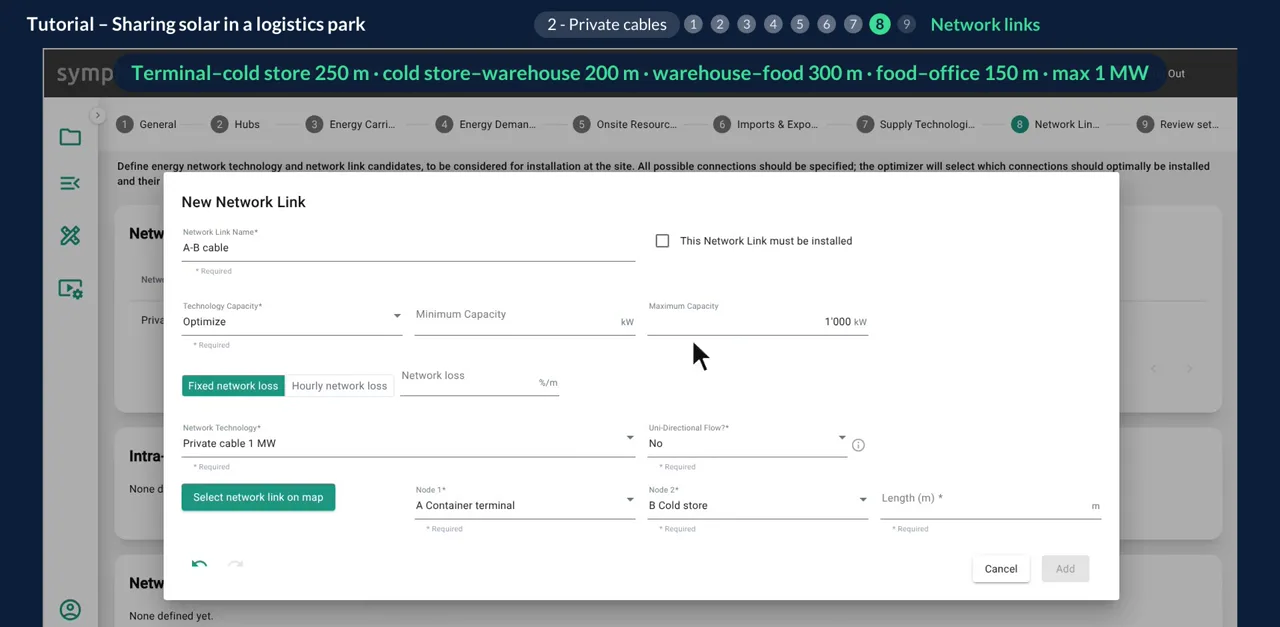
In Network links, add a network technology called “Private cable 1 MW”: CHF 1,600 per metre, CHF 16 per metre a year for maintenance and a 40-year lifetime.
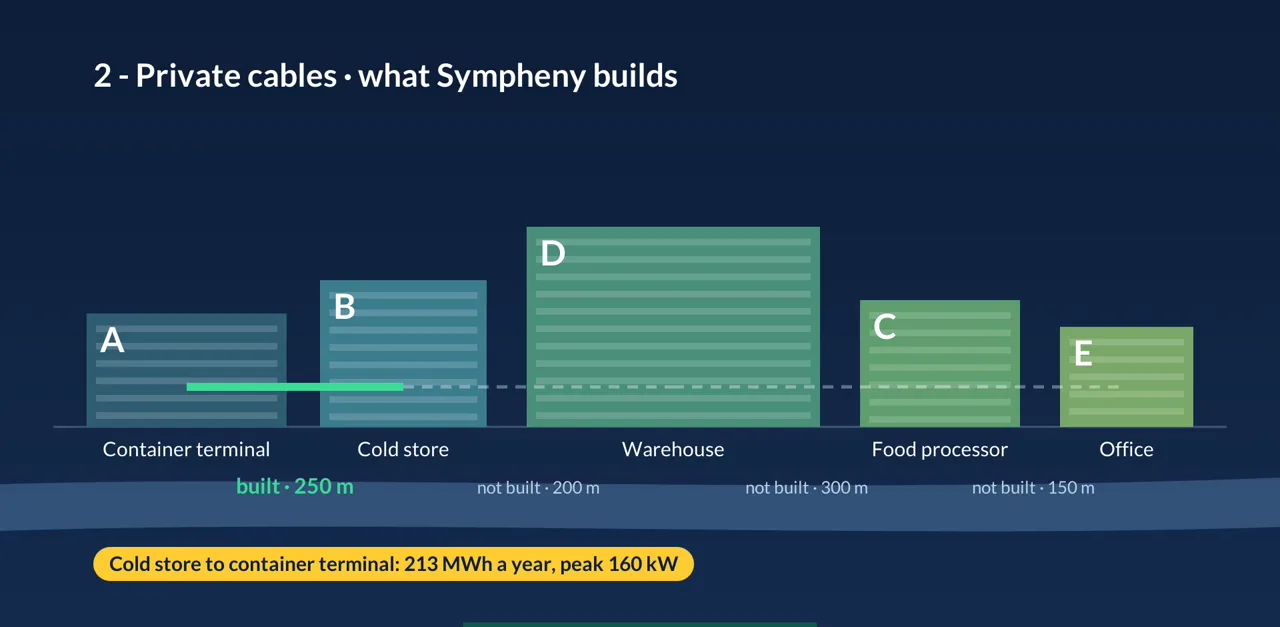
Then add four candidate links, each with its length and a maximum capacity of 1,000 kW: container terminal to cold store 250 m, cold store to warehouse 200 m, warehouse to food processor 300 m, and food processor to office 150 m. That is 900 m in total. Don't tick “must be installed”: Sympheny decides which links are worth building.
In the documentation: Analyses and scenarios ↗
- 14
Copy again: local electricity community
The second way is a local electricity community (LEG). There are no new cables: the power flows through the public grid.
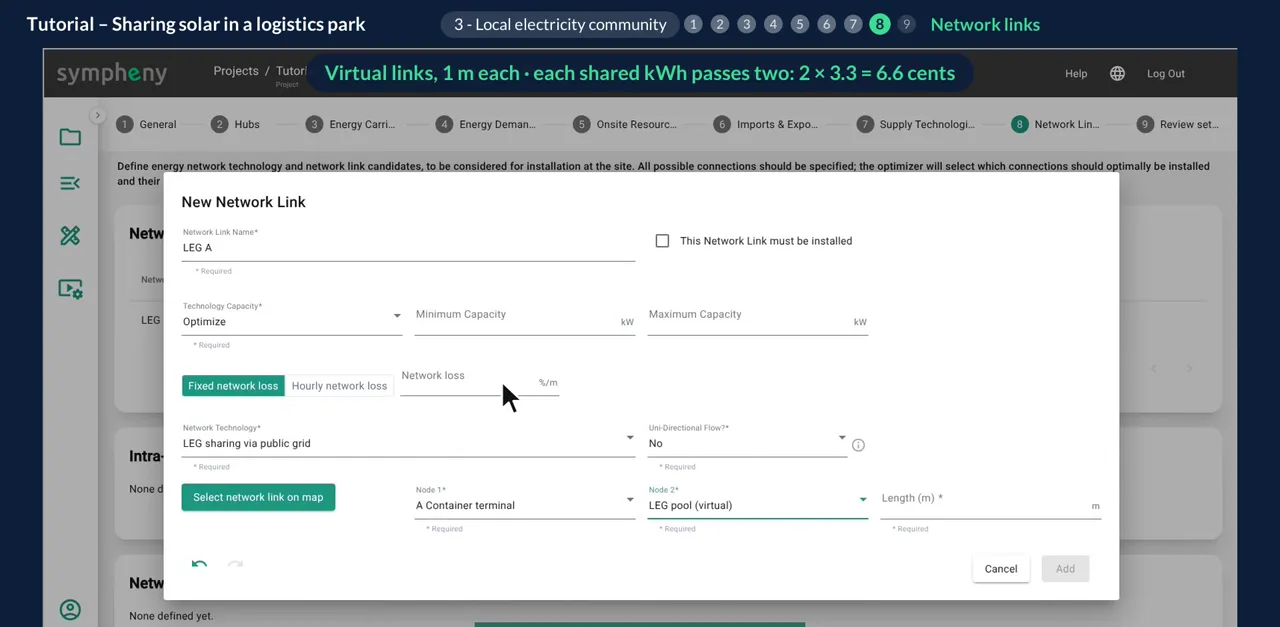
Copy scenario 1 and name it “3 - Local electricity community”. Add an extra hub, “LEG pool (virtual)”, that every company connects to.
Add a network technology called “LEG sharing via public grid” with no investment and an operating cost of 0.033 CHF per kWh per metre. Then add five links, one from each company to the pool, each 1 m long. They are virtual links, not cables: one metre is just a modelling convention that applies the sharing charge.
Each shared kWh passes two links, so it pays 2 × 3.3 = 6.6 cents. That stands for the reduced grid charges and levies at site level; the electricity itself comes from the companies' own solar.
To keep it simple, we've left out the LEG discount on the capacity charge.
In the documentation: Analyses and scenarios ↗
- 15
Run all four scenarios
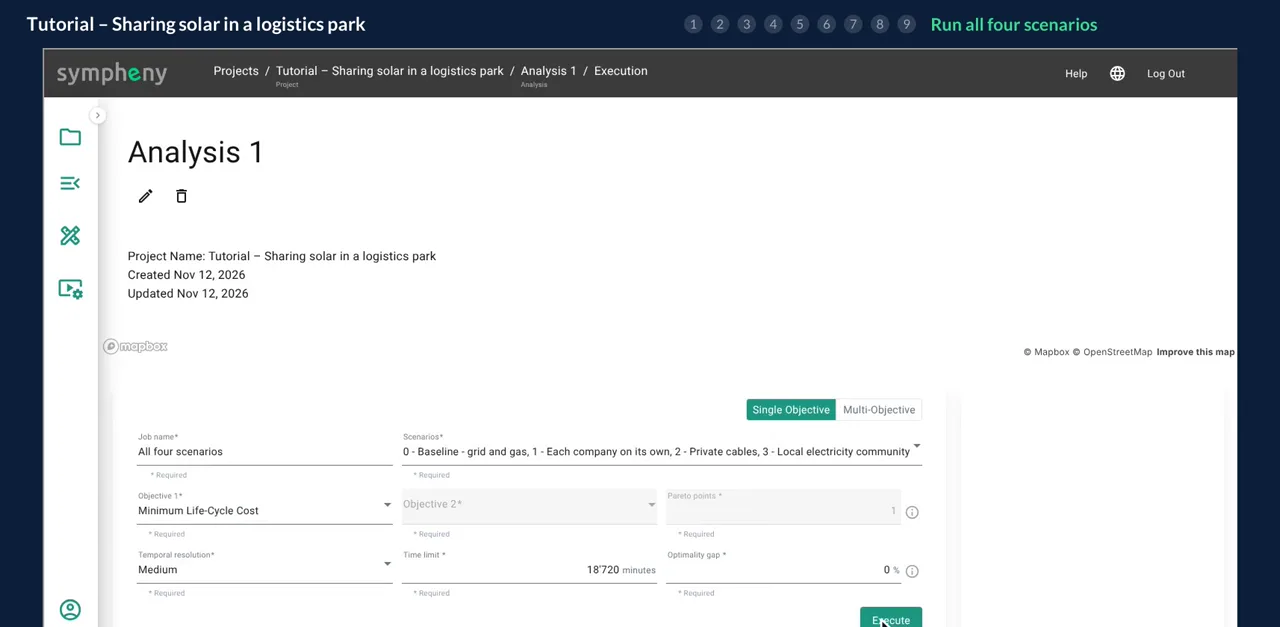
On the execution page, keep Single Objective with Minimum Life-Cycle Cost. Select all four scenarios, set the temporal resolution to Medium and the optimality gap to 0.5 %, then click Execute.
In the documentation: Execution ↗
- 16
Results: on its own, each company already saves a lot
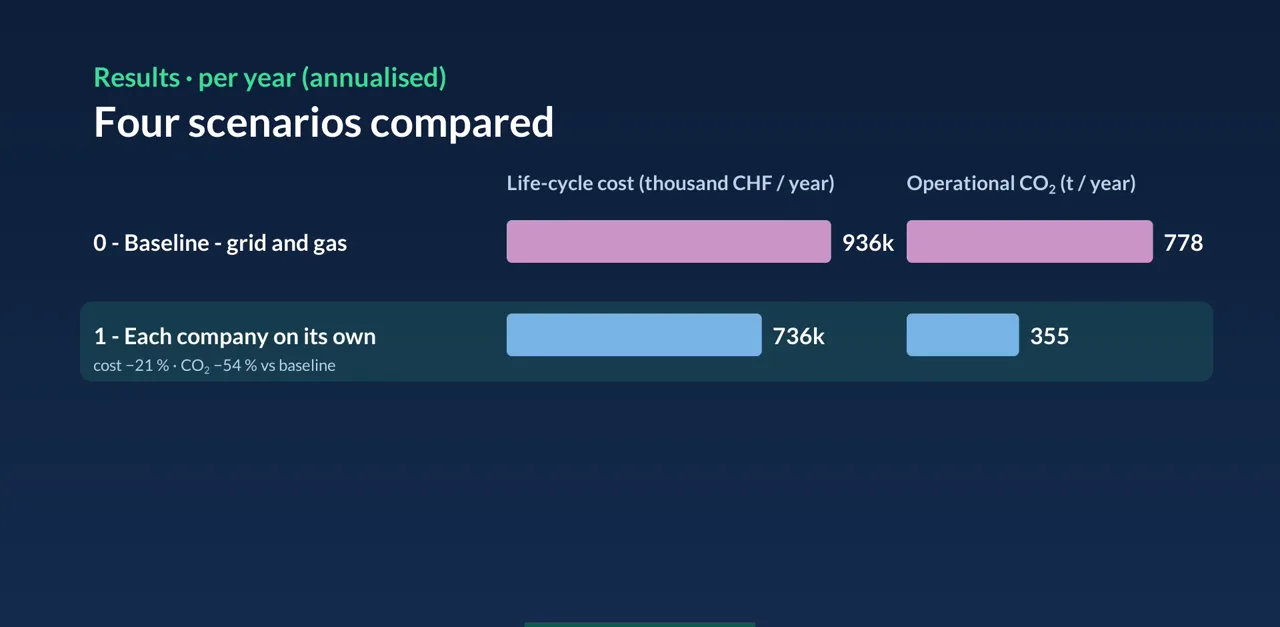
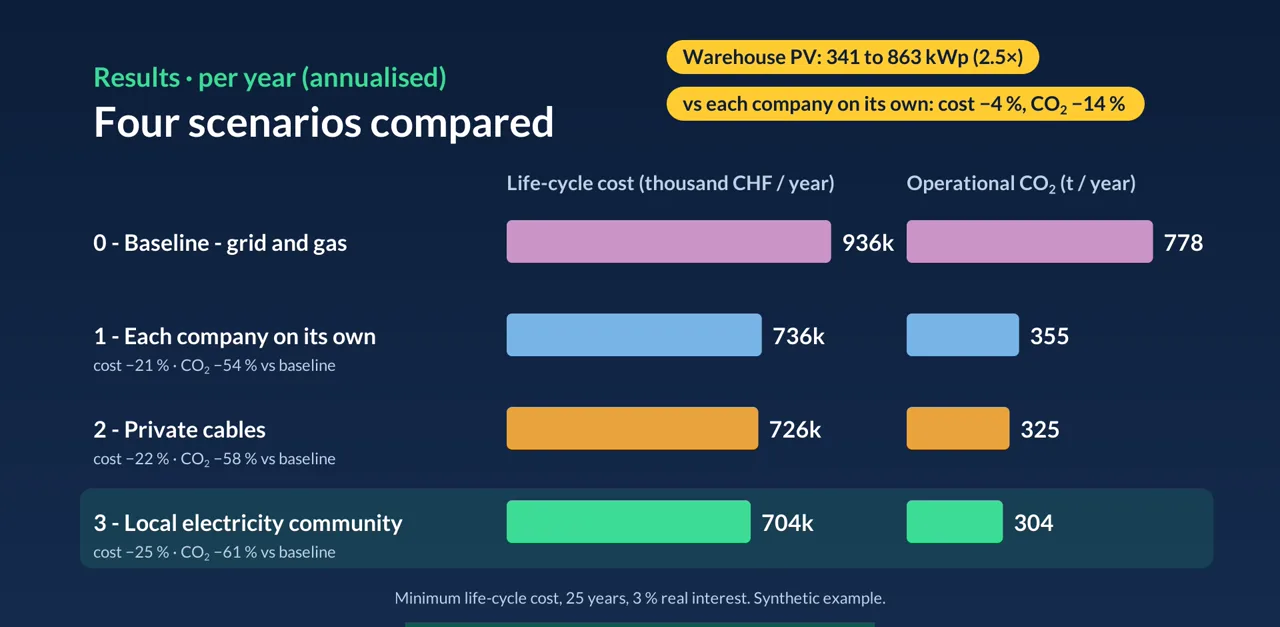
In the baseline, the park pays about CHF 936,000 a year and emits 778 tonnes of CO₂.
With each company on its own, heat pumps replace most of the gas and solar goes onto the roofs next to big loads. Cost falls to about CHF 736,000 a year (−21 %) and CO₂ to 355 tonnes (−54 %).
In the documentation: Results dashboard ↗
- 17
Solar pays where the power is used
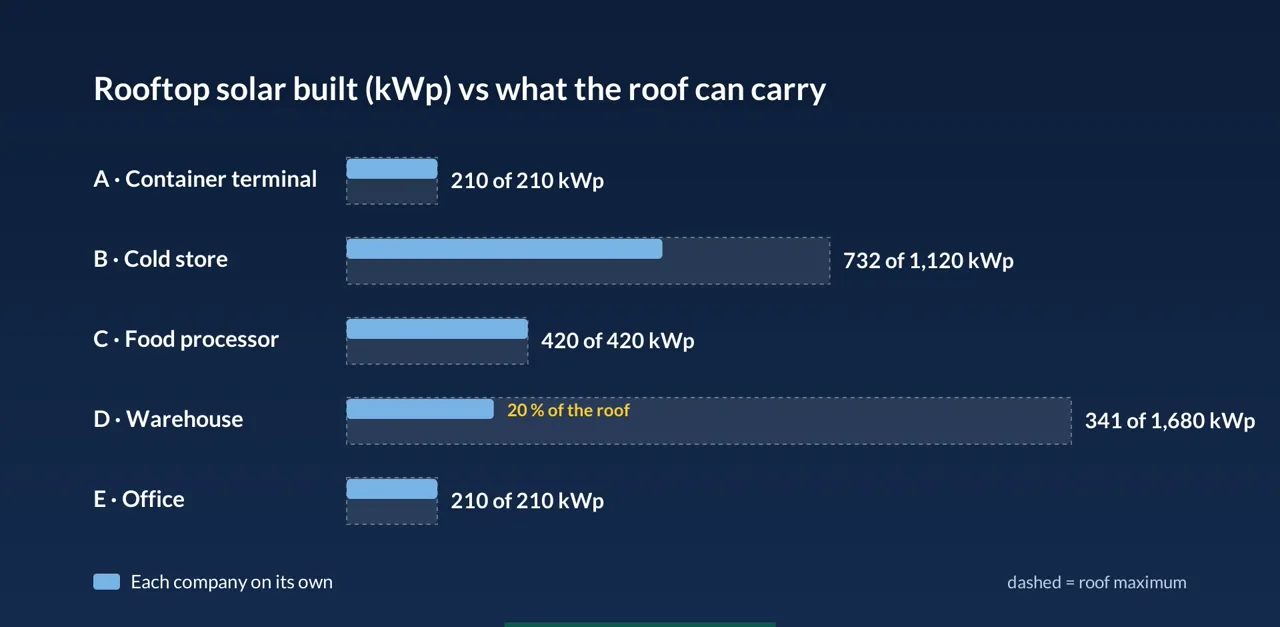
Look at how much rooftop solar each company builds. The container terminal, the food processor and the office fill their roofs. The cold store uses 732 of 1,120 kWp.
The warehouse uses only 341 of 1,680 kWp, a fifth of its roof. It has the biggest roof but needs little power, and surplus sells back for just 5 cents.
In the documentation: Results dashboard ↗
- 18
Private cables: only one link is built
Of the four candidate cables, the optimiser selects only one: 250 m from the cold store to the container terminal. It carries 213 MWh a year, with a peak of 160 kW.
The saving compared with each company on its own is small, about 1 %.
In the documentation: Results dashboard ↗
- 19
Local electricity community: everyone can share
Through the local electricity community, every company can share. The warehouse now builds 863 kWp, 2.5 times more than on its own.
Compared with each company on its own, cost falls another 4 % to about CHF 704,000 a year, and CO₂ falls 14 % to 304 tonnes.
In the documentation: Results dashboard ↗
- 20
If CO₂ matters more
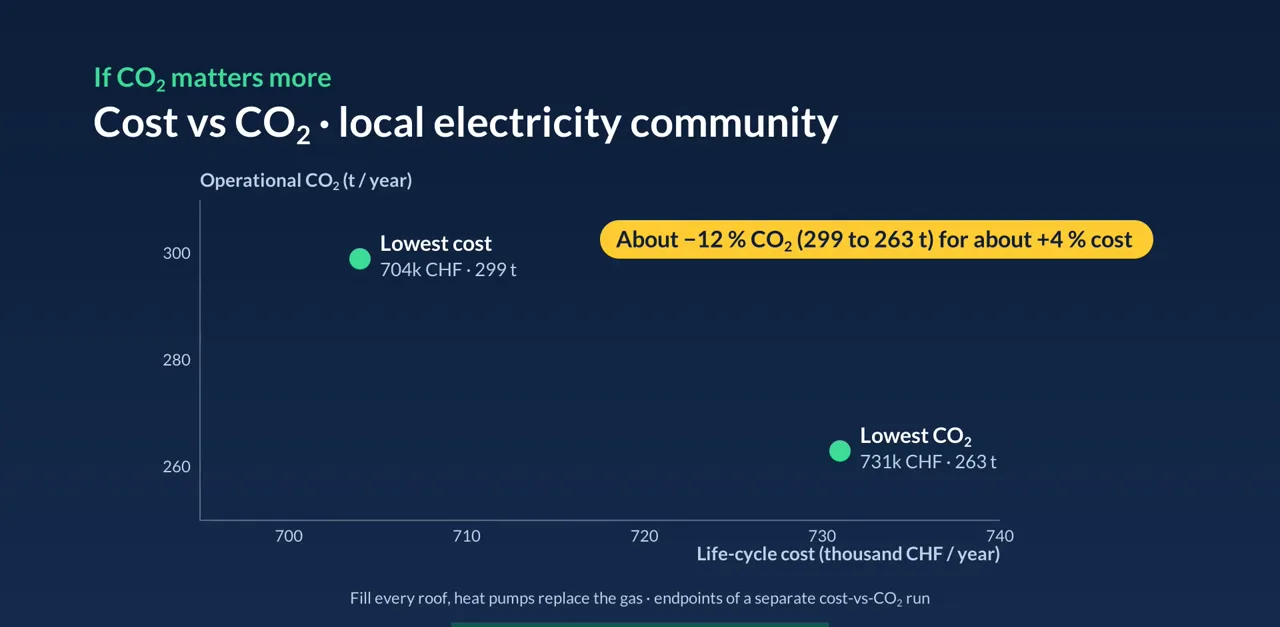
A separate cost-versus-CO₂ run on the local electricity community scenario shows the trade-off. Filling every roof and letting heat pumps replace all the gas cuts emissions by roughly another 12 % (299 to 263 tonnes) for about 4 % more cost.
Because this is a separate run, its lowest-cost point shows 299 tonnes rather than 304: the cost is the same, with a slightly different design. To try it yourself, choose Multi Objective on the execution page.
In the documentation: Results dashboard ↗
Results
Minimum life-cycle cost, annualised over 25 years at a 3 % real interest rate. CO₂ is operational only. Synthetic example: modelled outcomes under invented assumptions, not a forecast.
| Scenario | Life-cycle cost (CHF/year) | Cost vs baseline | Operational CO₂ (t/year) | CO₂ vs baseline |
|---|---|---|---|---|
| 0 - Baseline - grid and gas | 936,000 | – | 778 | – |
| 1 - Each company on its own | 736,000 | −21 % | 355 | −54 % |
| 2 - Private cables | 726,000 | −22 % | 325 | −58 % |
| 3 - Local electricity community | 704,000 | −25 % | 304 | −61 % |
- Where does solar pay? On roofs next to big loads: self-consumption matters more than roof size alone. On its own, the warehouse uses only a fifth of its roof.
- Own cables or a community? Sharing helps, and here the local electricity community gives the lowest cost: the optimiser selects only one private cable, and the saving from it is about 1 %.
- Cost and CO₂? Compared with the baseline, cost falls 25 % and operational CO₂ 61 %. If CO₂ matters more, filling every roof cuts roughly another 12 % for about 4 % more cost.
- Simplifications: no batteries, a constant heat-pump efficiency, a single sharing charge of 6.6 cents per kWh, and no LEG discount on the capacity charge.
Try it yourself
Change the export price, the cable cost or the LEG charge, and see what Sympheny shows. Copy a scenario and try it.
Build the model alongside the video in your own Sympheny account, then change one assumption and run it again.
Stuck on a step? Ask our support team. Tell us which tutorial and step, and we'll help you get unstuck. Contact support ↗
Video transcript
Five companies share a logistics park by the river:
a container terminal, a cold store, a food processor, a warehouse and an office.
Between them they use about three gigawatt hours of electricity a year, and they heat with gas.
The roofs could carry a lot of solar.
The warehouse roof is the biggest – but the warehouse itself uses very little power.
So, three questions.
Where does solar actually pay?
Should the companies share their solar power – with their own cables, or through a local electricity community?
And what does that do to cost and CO2?
Let's find out.
Start on the projects page:
click the plus, name the project, click the map to set its location, and add a picture.
In the new scenario, we set the basics:
Swiss francs, one stage, 2035, 25 years, with a 3 % real interest rate.
Each company gets its own hub.
That's what lets Sympheny optimise them separately – and later connect them.
We need four energy carriers:
electricity, heat at 50 to 60 degrees, gas, and the solar resource on the roofs.
Next, the demands.
For this example we've prepared an hourly electricity and heat profile for each company.
In your own project, upload metered data or generate profiles from the database.
Ten profiles in total.
For solar, we enter each roof's usable area and pick an irradiance profile from the database.
Generate the profile: Bern, roof, flat.
Grid electricity:
20 cents per kWh, plus 10 francs per kW per month for each company's own connection. Gas: 12 cents.
Surplus solar sells back at 5 cents.
We add rooftop solar and an air-water heat pump, alongside the existing gas boilers, which Sympheny can keep using.
Rooftop solar converts an assumed 13.5 % of the sunlight on the usable roof into electricity.
The heat pump turns one unit of electricity into 2.8 units of heat.
The gas boilers already exist, so there's no investment cost.
No network links yet:
each company is on its own.
We'll run it later, together with the other scenarios.
For a reference, we copy the scenario and remove solar and heat pumps:
the baseline, with grid power and gas only.
Now the first way to share:
a private cable at 1,600 francs per metre, with four candidate links – 900 metres in total.
Sympheny decides which ones to build.
Then we add the four candidate links, each with its length, up to one megawatt.
The second way:
a local electricity community, or LEG.
No cables – the power flows through the public grid.
We model it as a virtual pool that every company connects to.
At site level, each shared kWh pays 6.6 cents in reduced grid charges and levies – the electricity itself comes from the companies' own solar.
Five links connect each company to the pool.
They are virtual links, not cables:
one metre is just a modelling convention to apply the sharing charge.
We've left out the LEG discount on the capacity charge, to keep it simple.
We run all four scenarios.
Select all four scenarios, set the resolution to medium and the optimality gap to 0.5 %, and click Execute.
In the baseline, the park pays about 940,000 francs a year and emits almost 800 tonnes of CO2.
On its own, each company already saves a lot:
heat pumps replace most of the gas, and solar goes on the roofs next to big loads.
Cost −21 %, CO2 more than halved.
But look at the warehouse:
it uses only a fifth of its rooftop solar potential.
Solar pays where the power is used.
With private cables, under these assumptions only one link is selected:
250 metres from the cold store to the container terminal.
The saving is small – about 1 %.
Through the local electricity community, everyone can share.
The warehouse roof is used 2.5 times more.
Compared with each company on its own, cost falls another 4 % and CO2 14 %.
And if CO2 matters more:
filling every roof and replacing all the gas cuts emissions by roughly another 12 %, for about 4 % more cost.
So, the answers.
Self-consumption matters more than roof size alone.
Sharing helps – and here, the local electricity community beats private cables:
the optimiser selects only one private cable.
Compared with the baseline:
cost −25 %, operational CO2 −61 % – modelled, under synthetic assumptions.
Your turn:
change the export price, the cable cost or the LEG charge, and see what Sympheny shows.
Copy a scenario and try it.