The story
A logistics company runs hydrogen trucks. Every morning they fill up, about 640 kg of hydrogen a day, and the company wants that hydrogen to be green: made on site from wind and solar power.
But wind and sun don't follow the trucks' schedule. So how big should the electrolyser be? Solar, wind, or both? Should you store hydrogen, or electricity in a battery? And would grid electricity as a backup help?
You build the project from scratch in one site (hub), with an hourly hydrogen demand and hourly solar and wind profiles we prepared, and let Sympheny find the design with the lowest life-cycle cost. Then you copy the scenario, allow grid imports, and compare.
Step by step
Follow along in Sympheny. Each step has a screenshot from the video; click the time under it to watch that moment.
- 1
Create the project
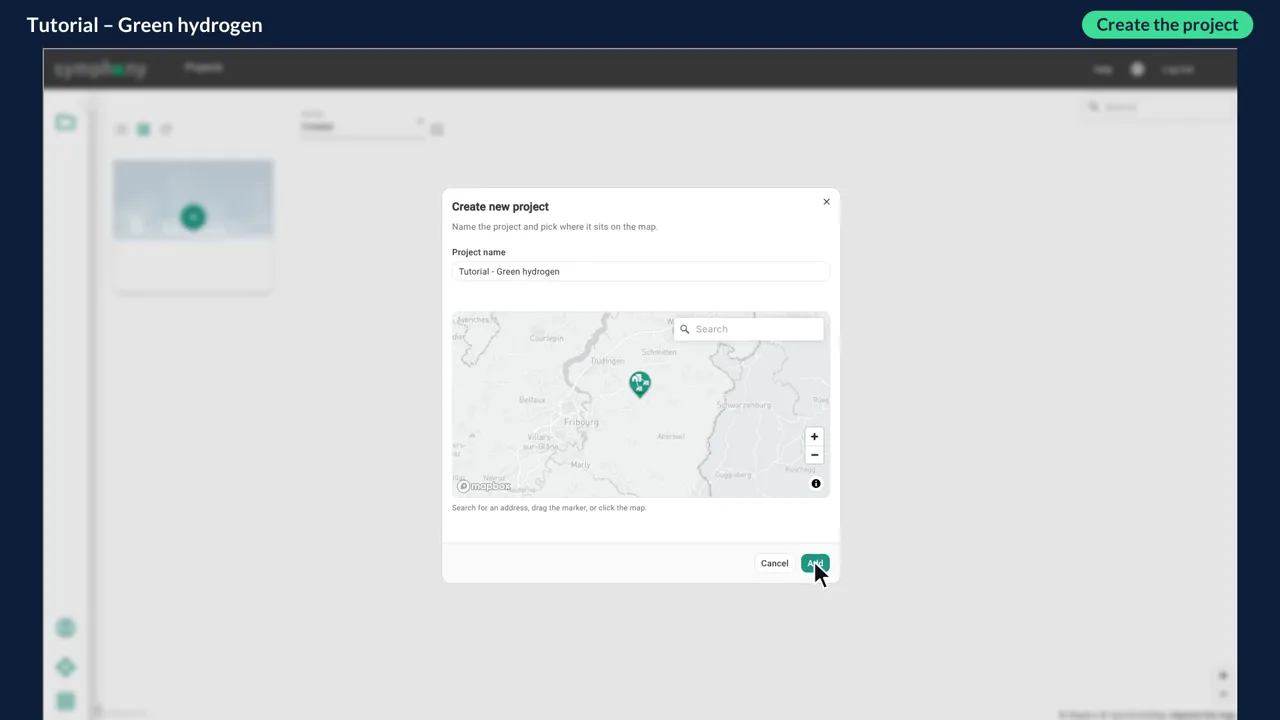
On the projects page, click the plus to create a new project. Give it a name, click the map to place it, and click Add.
Sympheny asks for a first scenario straight away. Call it "Scenario 1 - Solar and wind only", then open it.
In the documentation: Projects ↗
- 2
Step 1, General: currency and stage
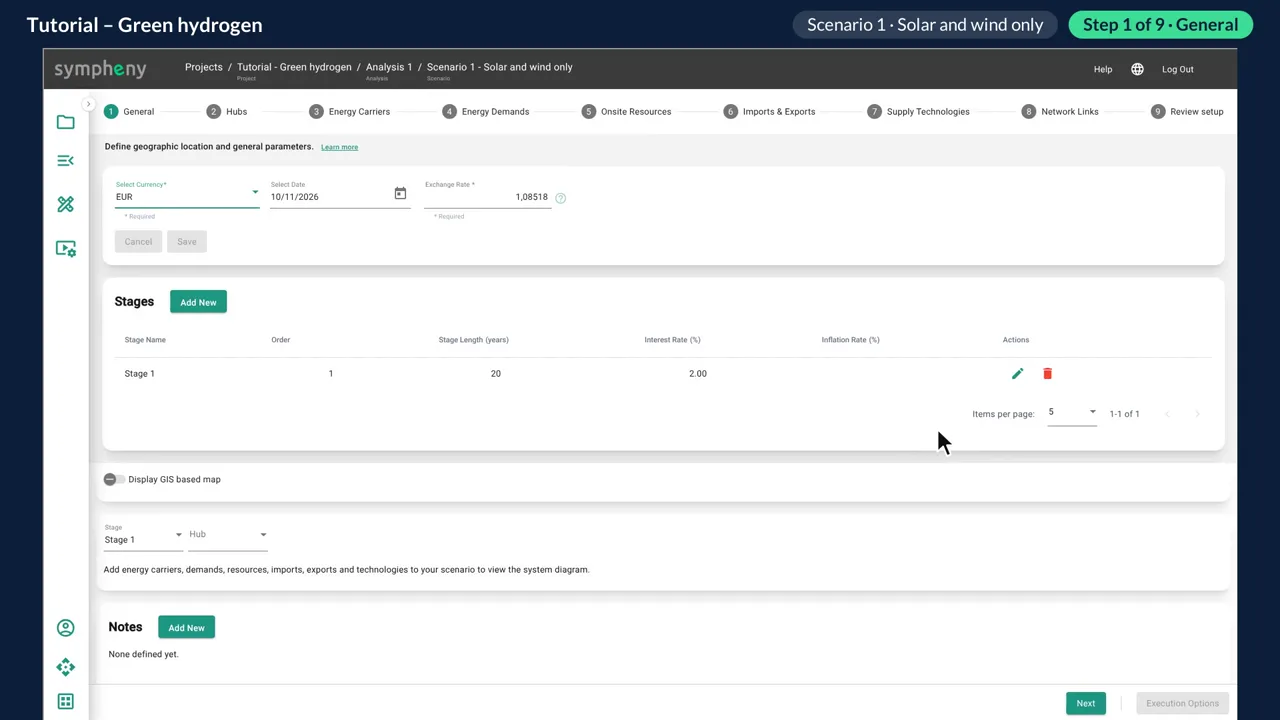
Choose euros as the currency and pick a date; Sympheny fills in the exchange rate. Save.
Under Stages, click Add New and add one stage of 20 years with an interest rate of 2 %. Click Add, then Next.
In the documentation: General step ↗ Stages ↗
- 3
Steps 2 and 3, Hubs and Energy Carriers
In Hubs, click Add New and add a single hub, the hydrogen site. Click Next.
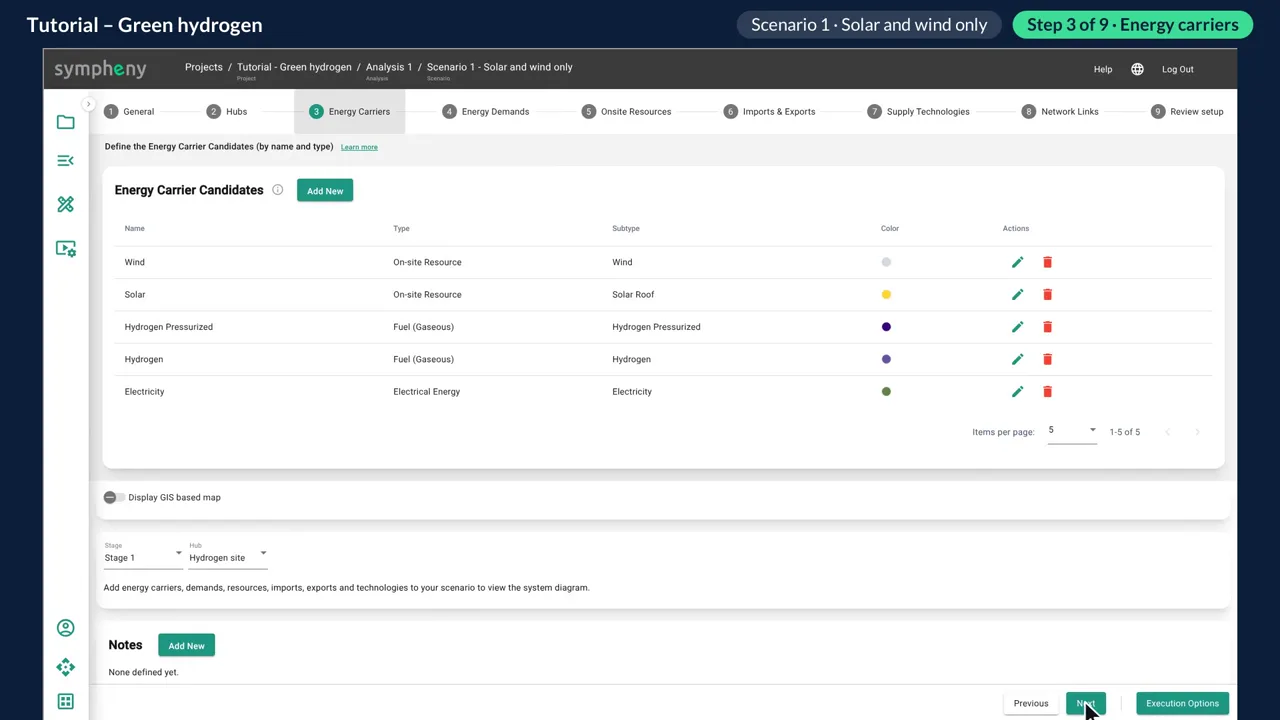
In Energy carriers, click Add New, pick a type and then a subtype. You need five: electricity, hydrogen (what the electrolyser makes), pressurised hydrogen (what the trucks take), and two on-site resources, solar and wind.
In the documentation: Hubs step ↗ Energy carriers step ↗
- 4
Step 4, Energy Demands: hydrogen for the trucks
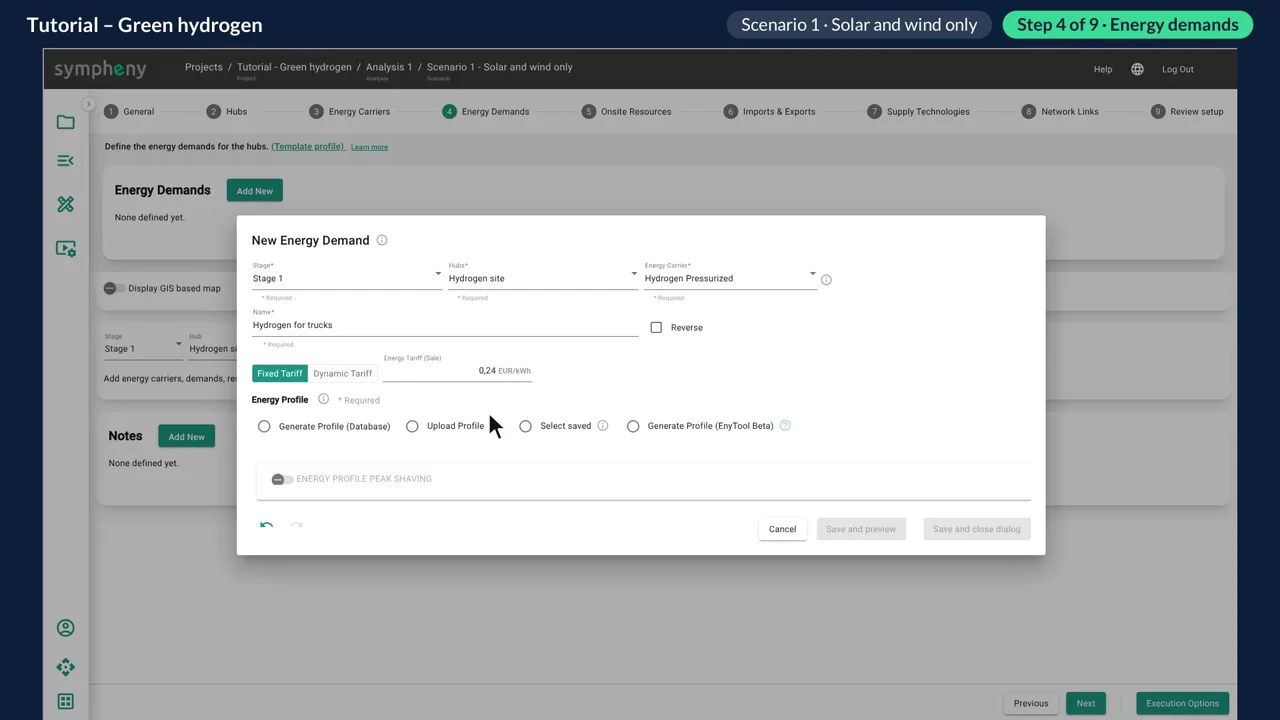
Click Add New, choose pressurised hydrogen and set the sale price: 0.24 € per kWh, which is about 8 € per kilogram of hydrogen.
Choose Upload Profile, add the hourly demand profile we prepared, and save.
In the documentation: Energy demands step ↗
- 5
Check the demand profile
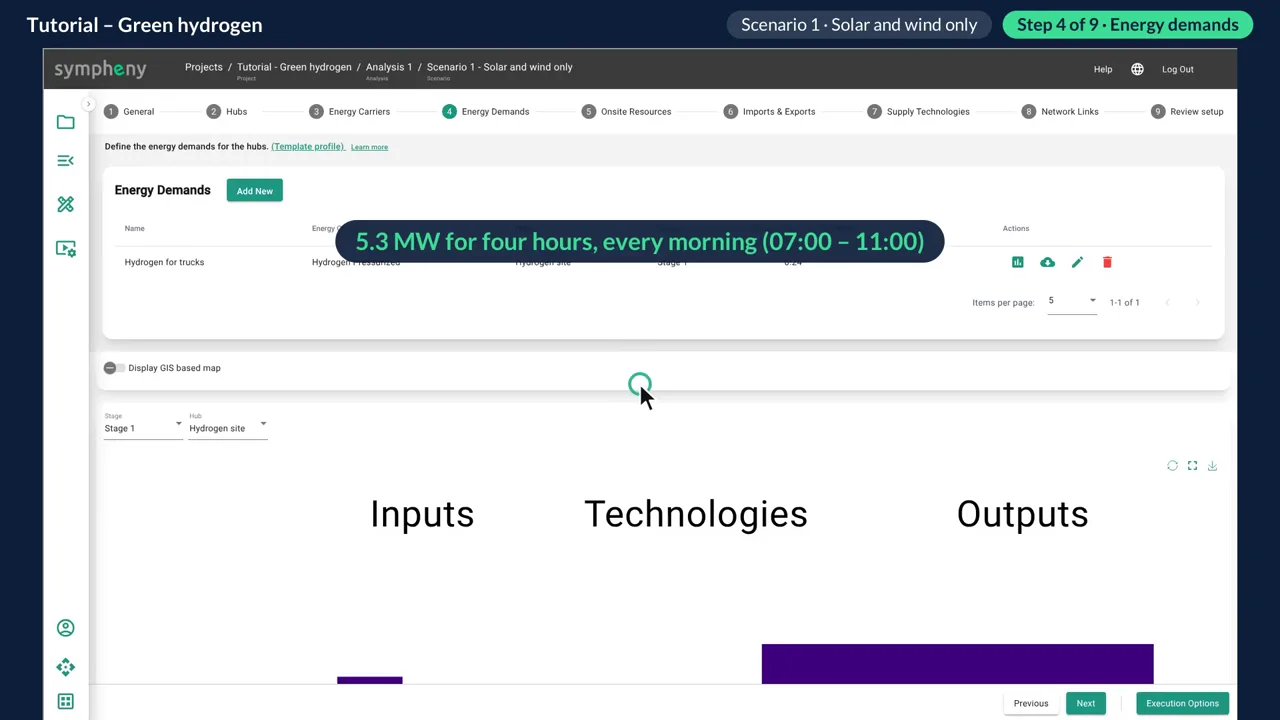
Click the chart icon to check the profile. The trucks fill up every morning: 5.3 MW for four hours, from 07:00 to 11:00. Over the year that adds up to 7.7 GWh, about 640 kg of hydrogen a day.
In the documentation: Energy demands step ↗
- 6
Step 5, Onsite Resources: solar field and wind
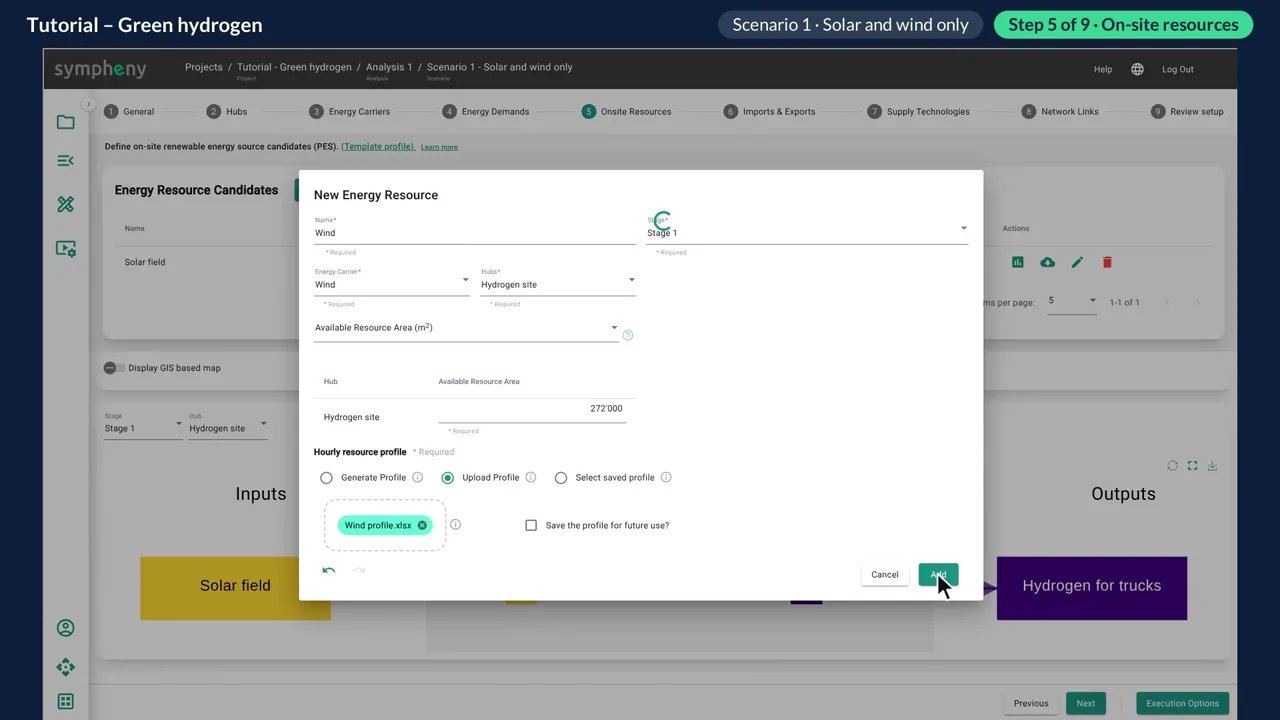
Add the solar field, about 147,000 m², with an hourly solar profile. Then add wind with its own hourly profile, and click Add.
In the documentation: On-site resources step ↗
- 7
Look at the wind, and leave imports empty
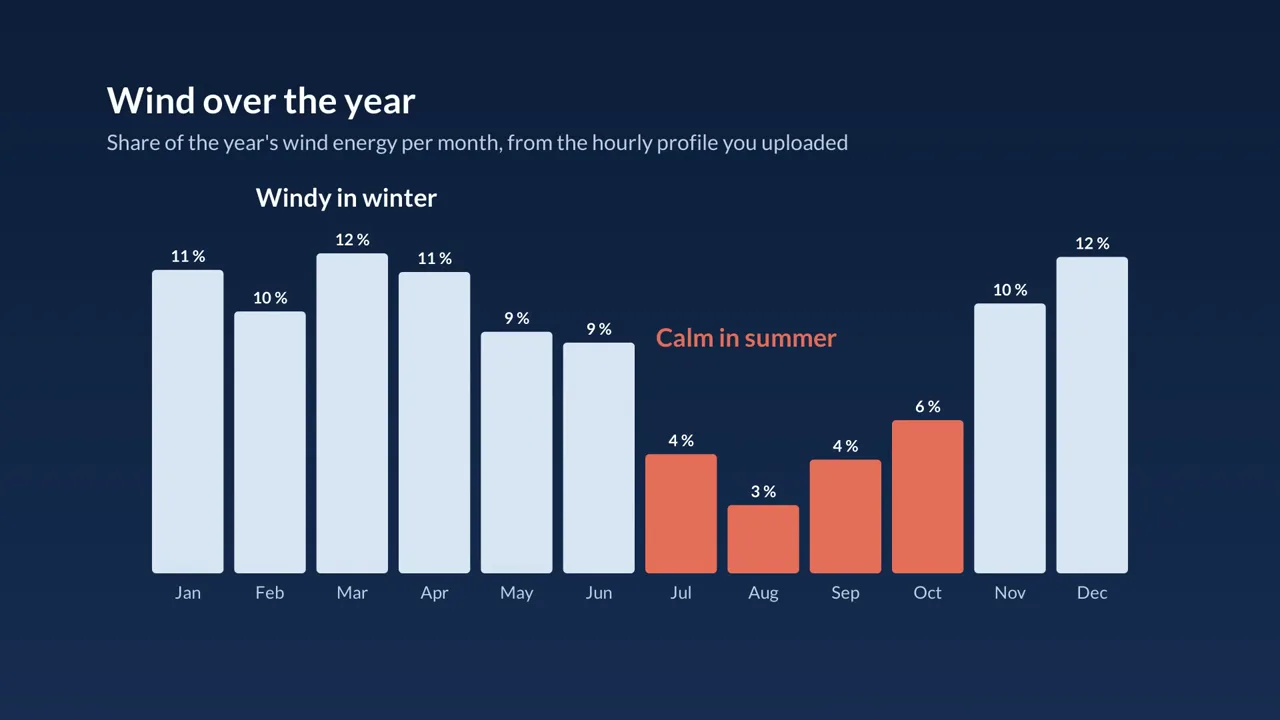
Over the year it is windy in winter and much calmer in summer: July to October together get only about a sixth of the year's wind energy. Keep that in mind for the results.
In Step 6, Imports & Exports, add nothing in this first scenario. Every kilowatt-hour has to come from the sun and the wind. Click Next.
In the documentation: Imports & exports step ↗
- 8
Step 7, Supply Technologies: electrolyser and compressor
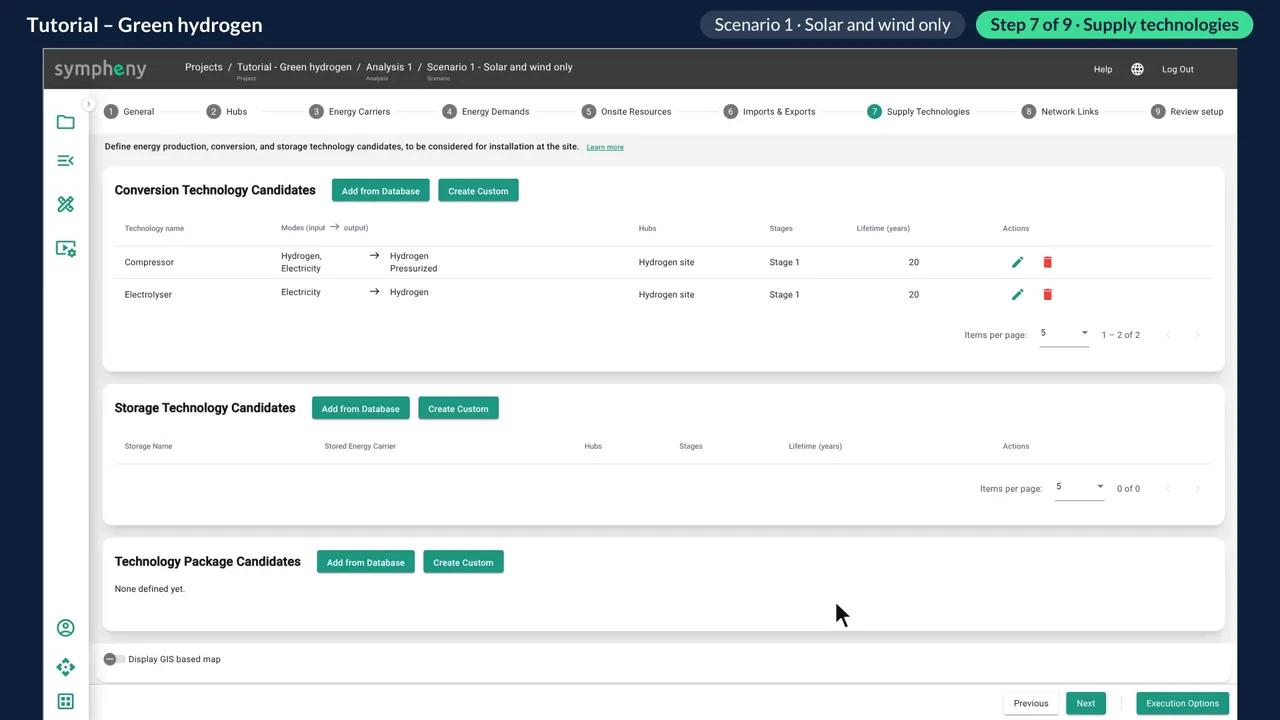
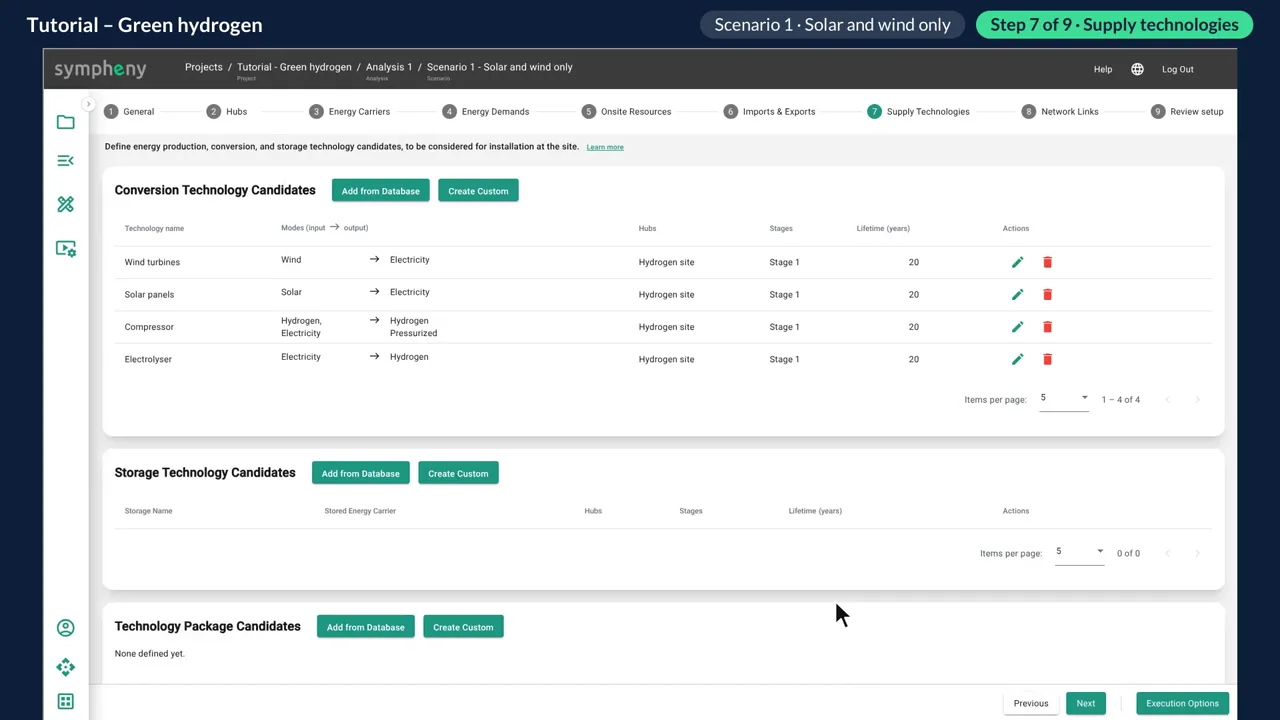
For the electrolyser, click Create Custom: electricity in, hydrogen out, at 60 % efficiency, a lifetime of 20 years and 2,000 € per kW. Click Add.
Then the compressor, also custom. It takes hydrogen plus a little electricity (10 %) and delivers pressurised hydrogen. Click Add.
In the documentation: Supply technologies step ↗
- 9
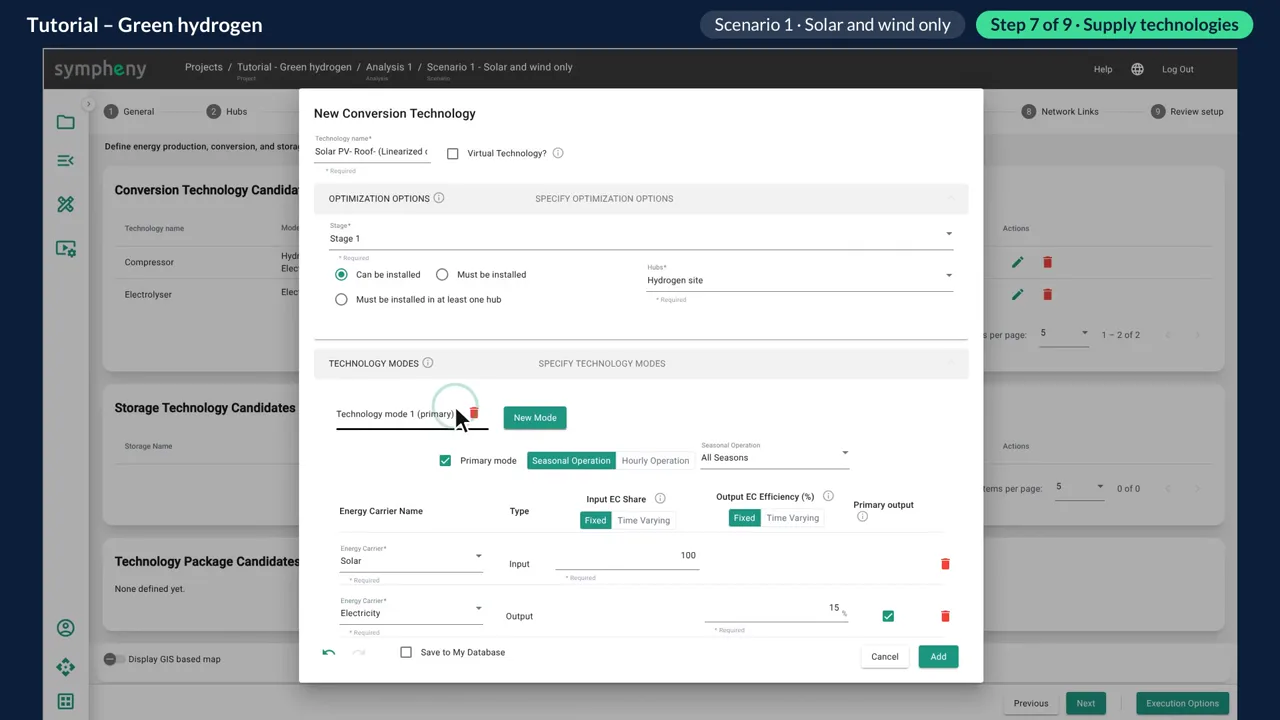
Solar panels from the database
For the solar panels, click Add from Database and pick a solar PV technology. Sympheny offers to add a missing energy carrier: click Yes, then switch the output to electricity.
Keep the database investment costs and set the cost per kWh generated to 0.05 €. Click Add.
In the documentation: Supply technologies step ↗
- 10
Wind turbines with a price per kWh
The wind turbines are custom again: wind in, electricity out. There is no investment cost. Instead you pay 0.05 € for every kWh, as with a power purchase agreement.
In the documentation: Supply technologies step ↗
- 11
Storage: hydrogen tank and battery
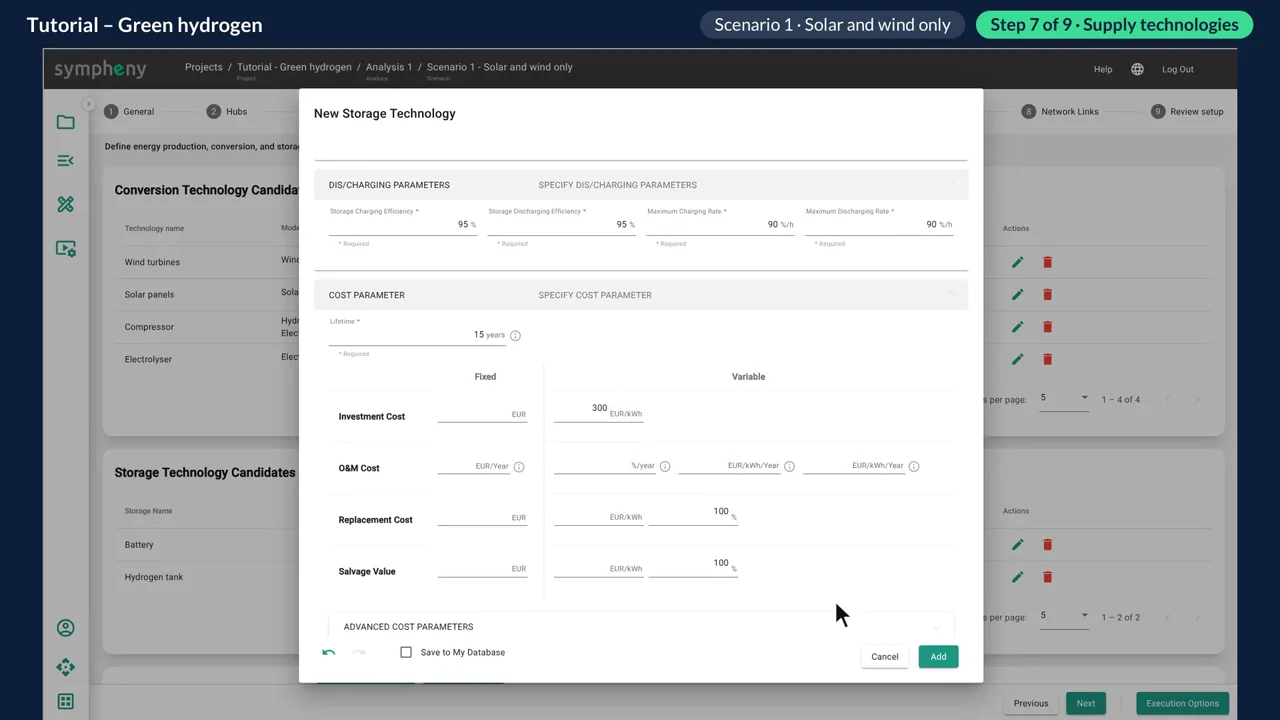
Click Create Custom for a hydrogen tank. The fastest it can fill is about three days and the fastest it can empty is about one: a charging rate of 1.39 % per hour and a discharging rate of 4.17 % per hour. Lifetime 20 years, 15 € per kWh.
Add a battery as the alternative: 95 % efficiency each way, up to 10 MWh, 300 € per kWh and a 15-year lifetime.
In the documentation: Supply technologies step ↗ Storage technologies ↗
- 12
Steps 8 and 9, Network Links and Review setup
You don't need a network for a single site, so skip Step 8.
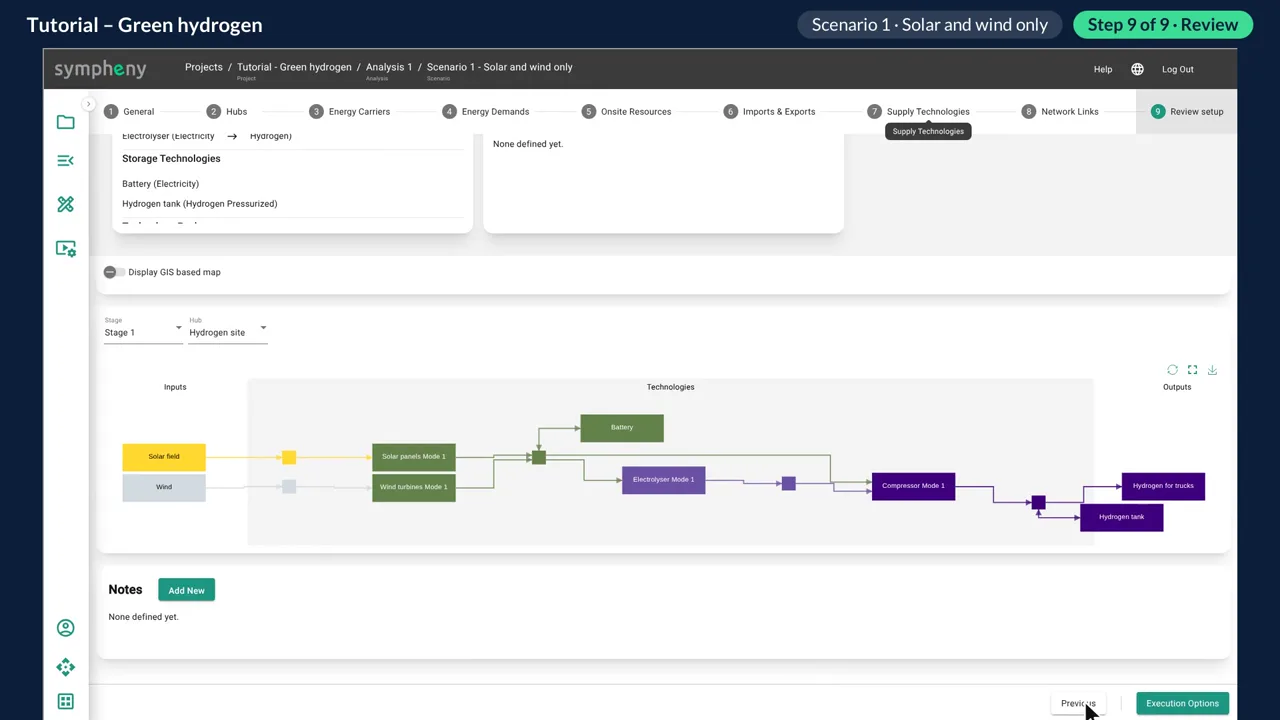
In Step 9, Review setup, the energy diagram shows the whole system: wind and solar make electricity, the electrolyser turns it into hydrogen, and the compressor gets it ready for the trucks. The tank and the battery can store energy along the way.
In the documentation: Network links step ↗
- 13
Run the optimisation
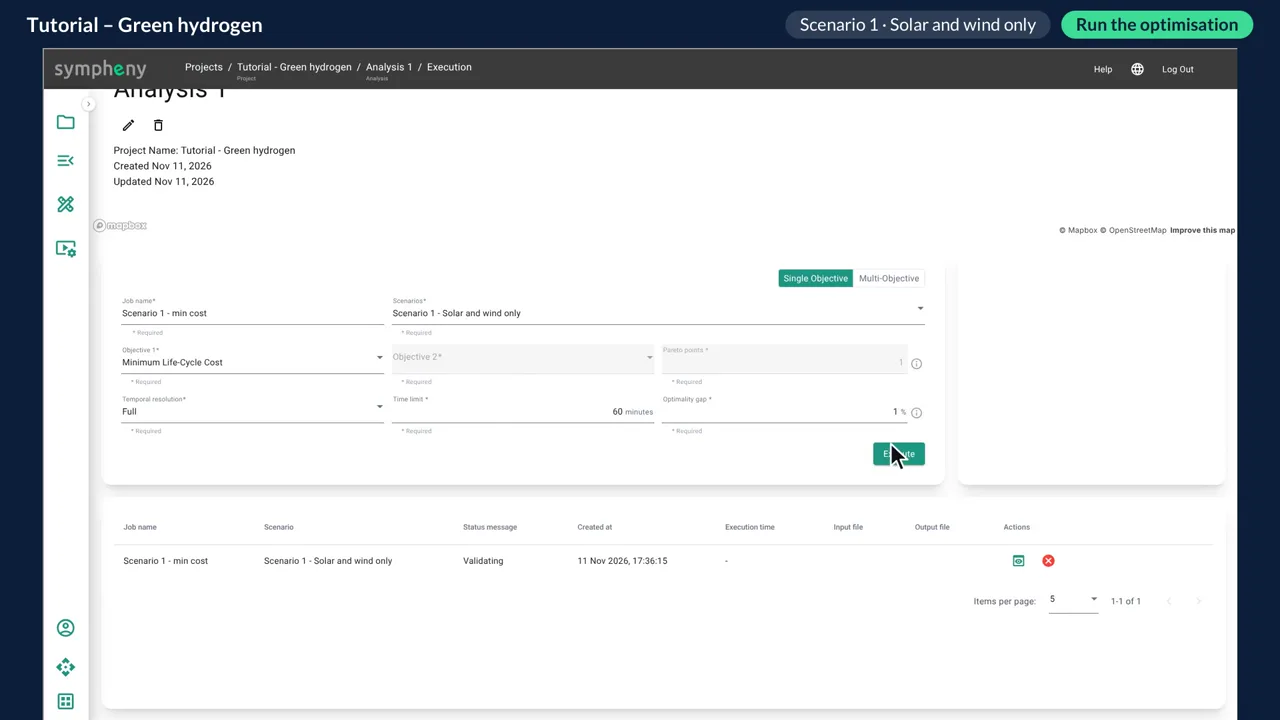
Click Execution Options. Choose Single Objective, name the job, pick the scenario, set minimum life-cycle cost and full hourly resolution, and click Execute.
In the recording it solved in about 20 seconds. To see the results, click the chart icon.
In the documentation: Execution ↗
- 14
Read the Sankey diagram
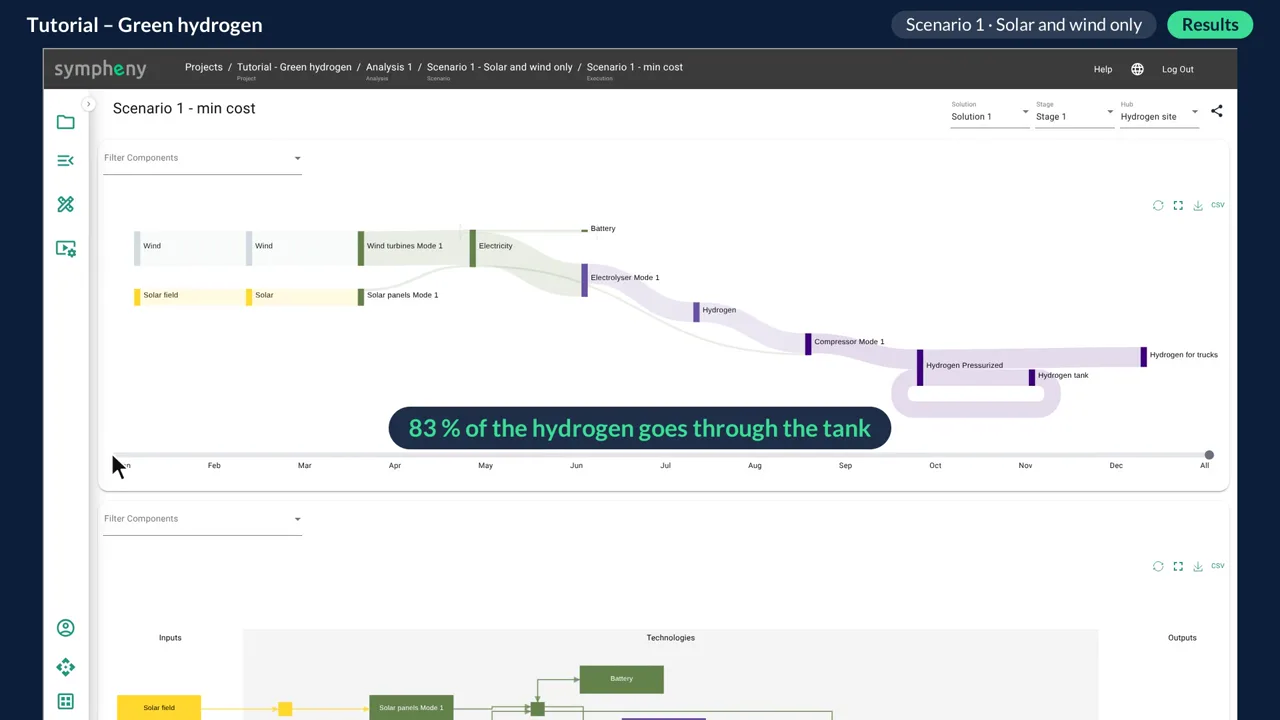
The Sankey diagram shows where the energy goes. Wind does almost all the work and solar adds a little. Most of the hydrogen, about 83 %, passes through the tank on its way to the trucks.
In the documentation: Results dashboard ↗
- 15
The tank is seasonal storage
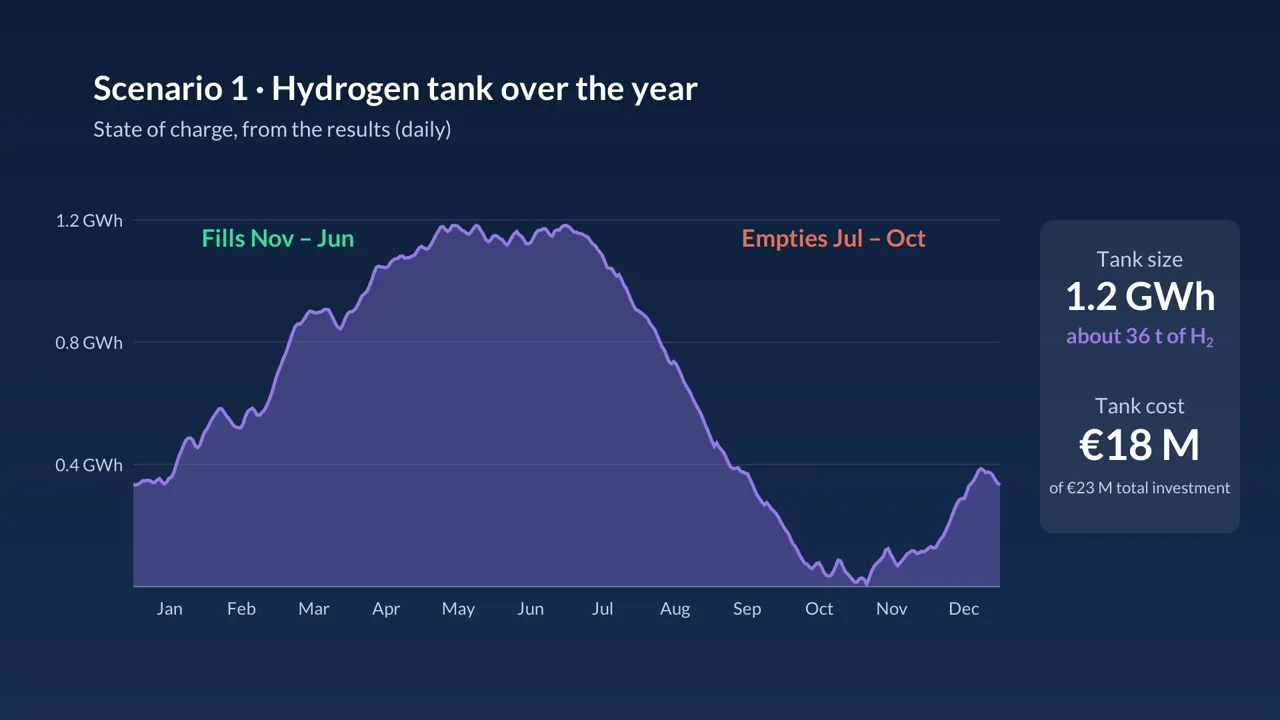
Remember the wind profile? The tank fills from November to June and empties from July to October. It is seasonal storage.
Seasonal storage is big: about 1.2 GWh, roughly 36 tonnes of hydrogen. The tank alone costs about 18 million euros of the 23 million total investment.
In the documentation: Results dashboard ↗
- 16
Sizes and hydrogen cost
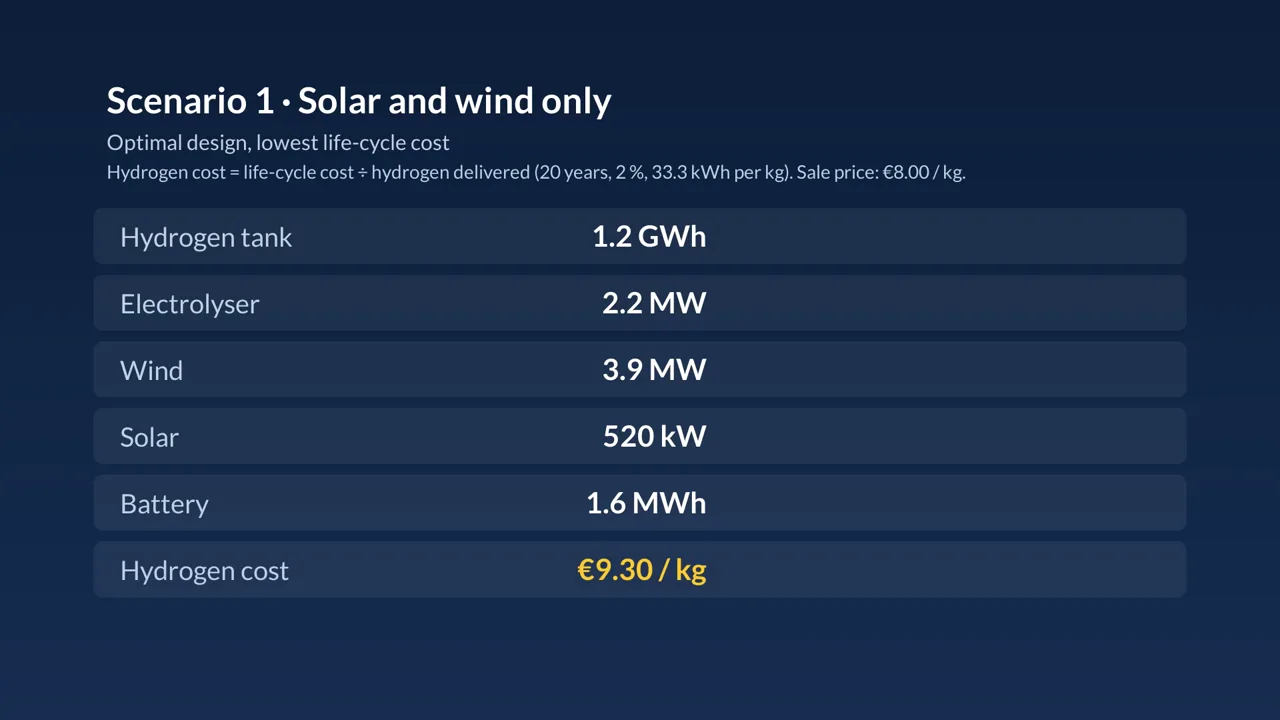
The rest of the system: a 2.2 MW electrolyser, 3.9 MW of wind, 520 kW of solar and a small battery of 1.6 MWh.
The hydrogen costs about 9.30 € per kilogram, more than the 8 € you sell it for. So the off-grid design doesn't pay its way at these prices.
In the documentation: Results dashboard ↗
- 17
Copy the scenario
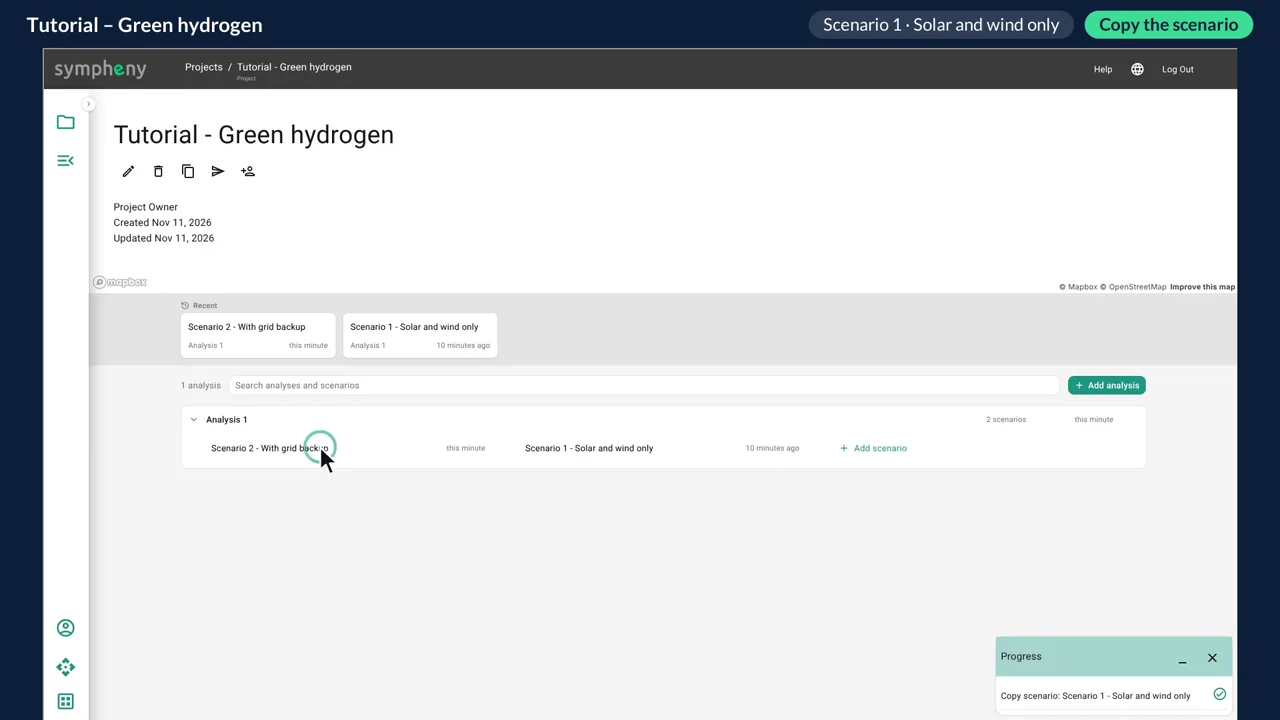
Would grid electricity help? On the project page, open the scenario's menu, click Copy, and name the copy "Scenario 2 - With grid backup".
In the documentation: Analyses and scenarios ↗
- 18
Add grid electricity as an import
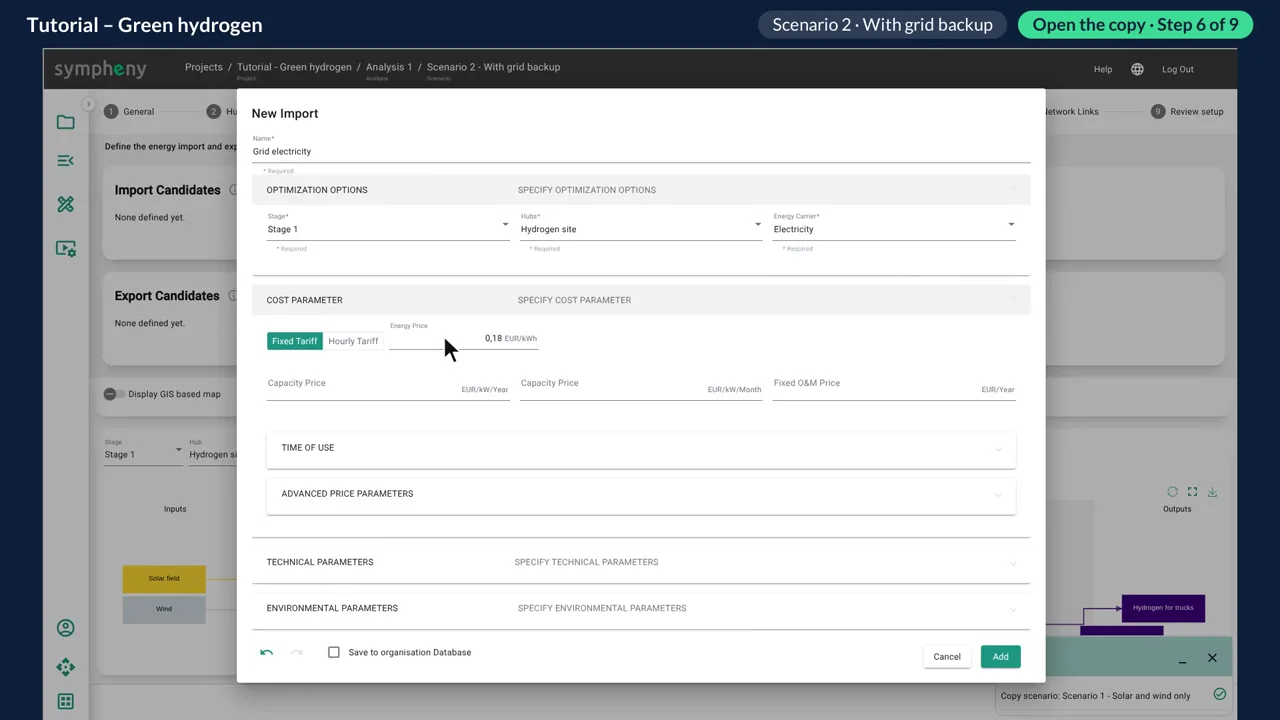
Open the new scenario and go to Step 6. Under Import candidates, click Add New: grid electricity at 0.18 € per kWh.
Under the environmental parameters, set its CO₂ intensity to 0.777 kg per kWh, a fossil-heavy grid. Click Add.
In the documentation: Imports & exports step ↗
- 19
Run Scenario 2
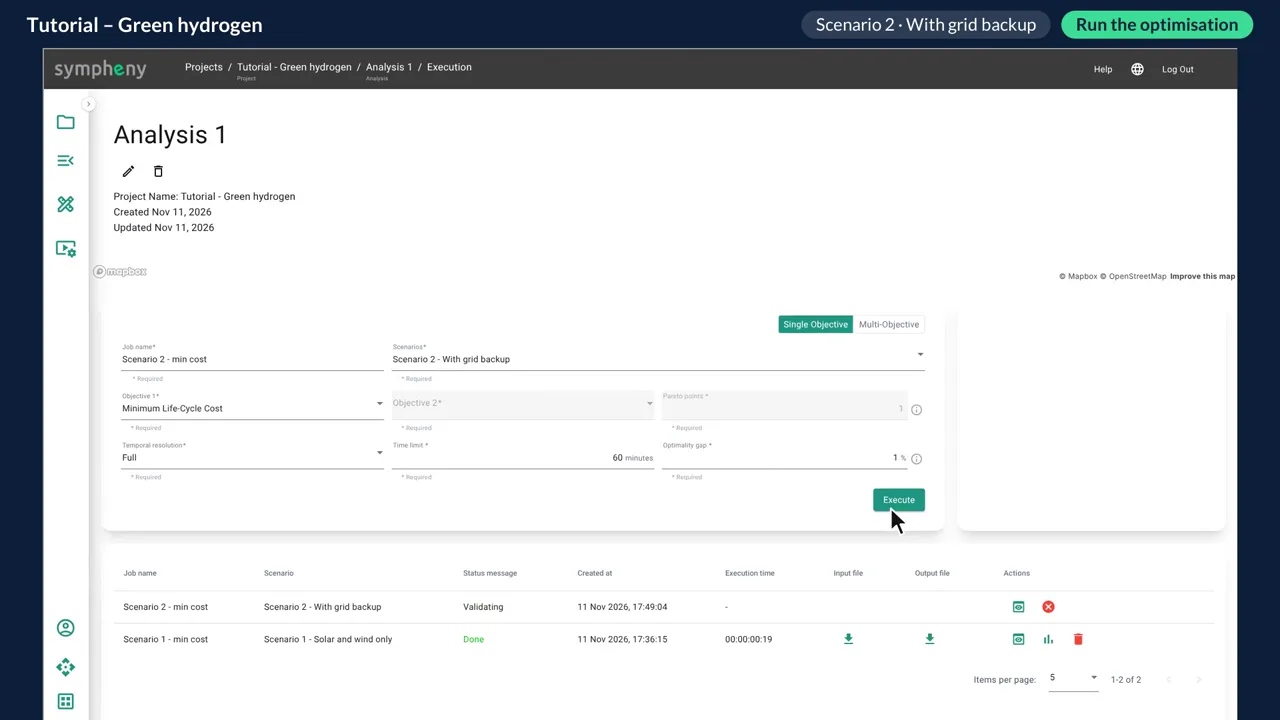
Open Execution Options again, use the same settings for Scenario 2, and click Execute.
In the documentation: Execution ↗
- 20
What the grid changes
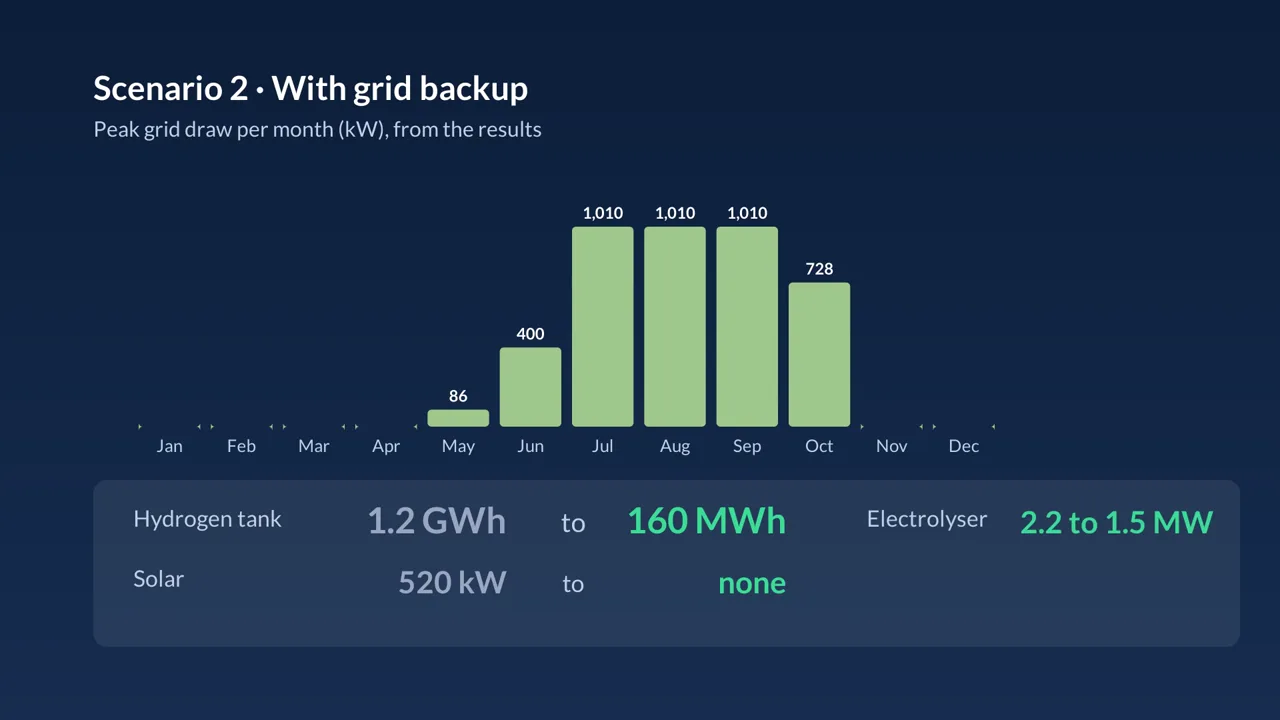
Grid electricity now comes in alongside the wind and fills the summer gap from May to October, peaking at about 1,010 kW in July to September.
The tank shrinks from 1.2 GWh to 160 MWh, solar drops out, and the electrolyser drops to 1.5 MW.
In the documentation: Results dashboard ↗
- 21
Compare the two scenarios
Side by side: hydrogen now costs about 6.30 € per kilogram, a third less. But it is no longer green: the grid adds about 2,400 tonnes of CO₂ a year, roughly 10 kg of CO₂ for every kilogram of hydrogen.
In the documentation: Results dashboard ↗
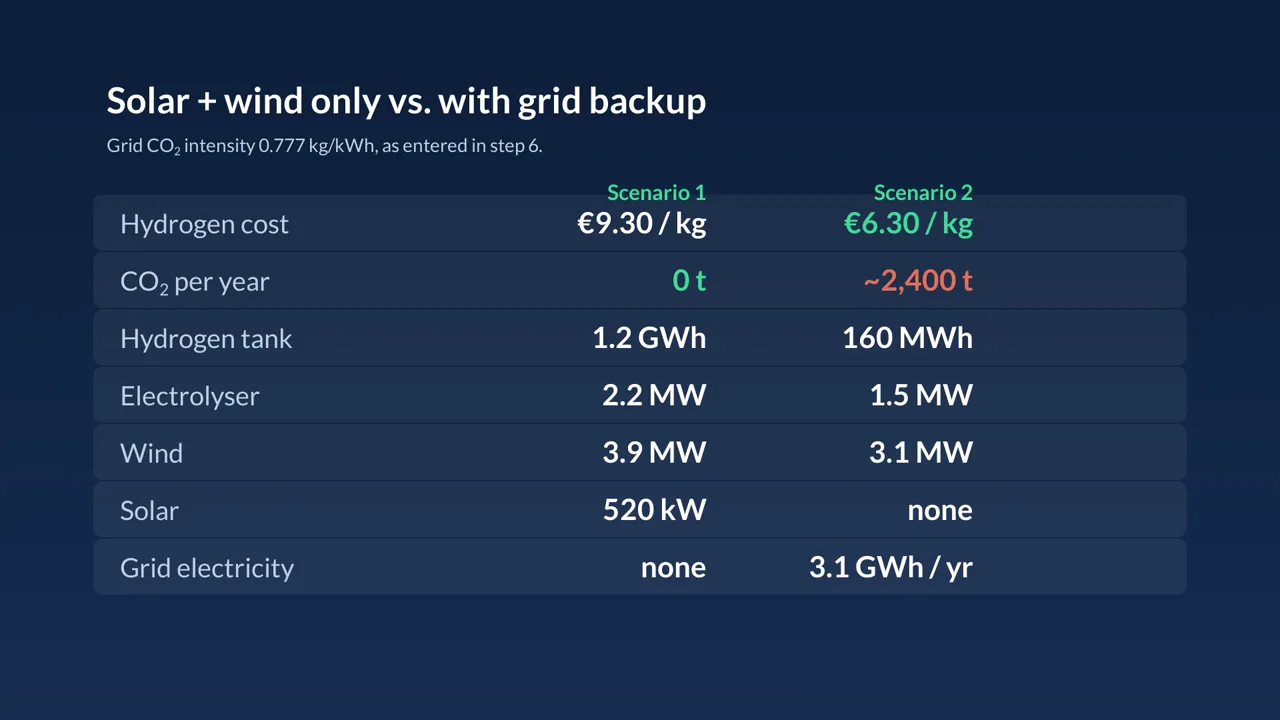
Results
Both designs at minimum life-cycle cost, 20 years at 2 % interest. Figures as shown in the video, rounded.
| Solar and wind only | With grid backup | |
|---|---|---|
| Hydrogen cost | €9.30 / kg | €6.30 / kg |
| CO₂ per year | 0 t | about 2,400 t |
| Hydrogen tank | 1.2 GWh | 160 MWh |
| Electrolyser | 2.2 MW | 1.5 MW |
| Wind | 3.9 MW | 3.1 MW |
| Solar | 520 kW | none |
| Grid electricity | none | 3.1 GWh / yr |
- Electrolyser: 2.2 MW off-grid, 1.5 MW with grid backup.
- Wind does most of the work; solar plays a small part.
- Store hydrogen, not electricity: the battery stays small (1.6 MWh off-grid), and the tank becomes seasonal storage.
- Grid backup cuts the hydrogen cost by about a third, but with this fossil-heavy grid the hydrogen is no longer green.
- Try a different tank cost or a cleaner grid, and see what moves.
Try it yourself
Build the model alongside the video in your own Sympheny account, then change one assumption and run it again.
Stuck on a step? Ask our support team. Tell us which tutorial and step, and we'll help you get unstuck. Contact support ↗
Video transcript
A logistics company wants to fuel its hydrogen trucks with green hydrogen, made on site from wind and solar power. Every morning, the trucks fill up: about 640 kilograms of hydrogen a day. But wind and sun don't follow that schedule.
So, how big should the electrolyser be? Solar, wind, or both? Should we store hydrogen, or electricity in a battery? And would grid electricity as a backup help? Let's find out. Start on the projects page. Click the plus to create a new project.
Give it a name, click the map to place it, and click Add. Sympheny asks for a first scenario straight away: Scenario 1, solar and wind only. Then open it. Step 1, General. Choose the currency: euros. Pick a date, and Sympheny fills in the exchange rate. Save.
Under Stages, click Add New: one stage of 20 years, with an interest rate of 2 percent. Add, then Next. Step 2, Hubs. Click Add New and add one hub: the hydrogen site. Next. Step 3, Energy carriers. Click Add New, pick a type, then a subtype.
We need five: electricity, hydrogen from the electrolyser, pressurised hydrogen for the trucks, and two on-site resources, solar and wind. Step 4, Energy demands.
Click Add New, choose pressurised hydrogen, and set the sale price: 24 cents per kilowatt-hour, about 8 euros per kilogram. Choose Upload Profile and drop in the hourly profile we prepared. Save.
Click the chart icon to check it: 5.3 megawatts for four hours every morning, when the trucks fill up. That's 7.7 gigawatt-hours a year. Step 5, On-site resources. Add the solar field: about 147,000 square metres, with an hourly solar profile.
Then wind, with its own hourly profile. Add. Over the year it's windy in winter, and much calmer in summer. Keep that in mind. Step 6, Imports and exports. In this first scenario there are none: every kilowatt-hour has to come from the sun and the wind. Next.
Step 7, Supply technologies. For the electrolyser, click Create Custom. Electricity in, hydrogen out, at 60 percent efficiency. A lifetime of 20 years, and 2,000 euros per kilowatt. Add. Next, the compressor.
It takes hydrogen plus a little electricity, 10 percent, and delivers pressurised hydrogen. Add. For the solar panels, click Add from Database and pick a solar PV technology.
Sympheny offers to add a missing energy carrier: click Yes, then switch the output to electricity. We keep the database costs, and set the cost per kilowatt-hour to 5 cents. Add. The wind turbines are custom again: wind in, electricity out.
No investment cost here: we pay 5 cents for every kilowatt-hour, like a power purchase agreement. Now the storage. Click Create Custom for a hydrogen tank.
The fastest it can fill is about three days, and the fastest it can empty is about one: a charging rate of 1.39 percent per hour, and 4.17 for discharging. Twenty years, 15 euros per kilowatt-hour.
And a battery as the alternative: 95 percent efficiency each way, up to 10 megawatt-hours, 300 euros per kilowatt-hour, 15 years. Step 8, Networks. We don't need one here. Step 9, Review.
The energy diagram shows the whole system: wind and solar make electricity, the electrolyser turns it into hydrogen, and the compressor gets it ready for the trucks. The tank and the battery can store energy along the way. Click Execution Options.
Choose Single Objective, name the job, pick the scenario, minimum life-cycle cost, and full hourly resolution. Execute. It solved in about 20 seconds. To see the results, click the chart icon. The Sankey diagram shows where the energy goes.
Wind does almost all the work; solar adds a little. And most of the hydrogen passes through the tank. Remember the wind profile? The tank fills from November to June, and empties from July to October. It's seasonal storage.
And seasonal storage is big: about 1.2 gigawatt-hours, roughly 36 tonnes of hydrogen. The tank alone costs about 18 million euros. The rest: a 2.2 megawatt electrolyser, 3.9 megawatts of wind, 520 kilowatts of solar, and a small battery.
The hydrogen costs about 9.30 euros per kilogram, more than the 8 euros we sell it for. So, would grid electricity help? On the project page, open the scenario's menu, click Copy, and name it Scenario 2, with grid backup. Open it and go to Step 6.
Under Import candidates, click Add New: grid electricity at 18 cents per kilowatt-hour. Under environmental parameters, set its CO₂ intensity: 0.777 kilograms per kilowatt-hour, a fossil-heavy grid. Add.
Then Execution Options, with the same settings for Scenario 2. Execute. Grid electricity now comes in alongside the wind. Now the grid fills the summer gap, from May to October.
The tank shrinks from 1.2 gigawatt-hours to 160 megawatt-hours, solar drops out, and the electrolyser drops to 1.5 megawatts. Hydrogen now costs about 6.30 euros per kilogram, a third less.
But it's no longer green: the grid adds about 2,400 tonnes of CO₂ a year, roughly 10 kilograms for every kilogram of hydrogen. So, the answers. The electrolyser: 2.2 megawatts off-grid, 1.5 with grid backup.
The wind turbines do most of the work; solar plays a small part. Store hydrogen, not electricity: the battery stays small. And grid backup cuts the cost by a third, but the hydrogen is no longer green. That's the green hydrogen tutorial.
Try a different tank cost or a cleaner grid, and see what moves. If you have questions, click Help at the top of the app.