The story
A company is replacing its fleet with ten electric vans. They drive from 08:00 to 12:00 and from 13:00 to 17:00, and they're parked over lunch and overnight. On the roof there's solar, which peaks around midday.
With dumb charging, the vans charge at full power the moment they're plugged in: at noon, and again at five. With smart charging, the same energy is spread over the parked hours, using as much solar as possible. With vehicle-to-grid, the vans' batteries can also give electricity back.
Two questions: which strategy uses the most of your own solar, and is a stationary battery worth the investment? The project has one scenario per strategy.
Step by step
Follow along in Sympheny. Each step has a screenshot from the video; click the time under it to watch that moment.
- 1
Step 1, General: currency and planning period
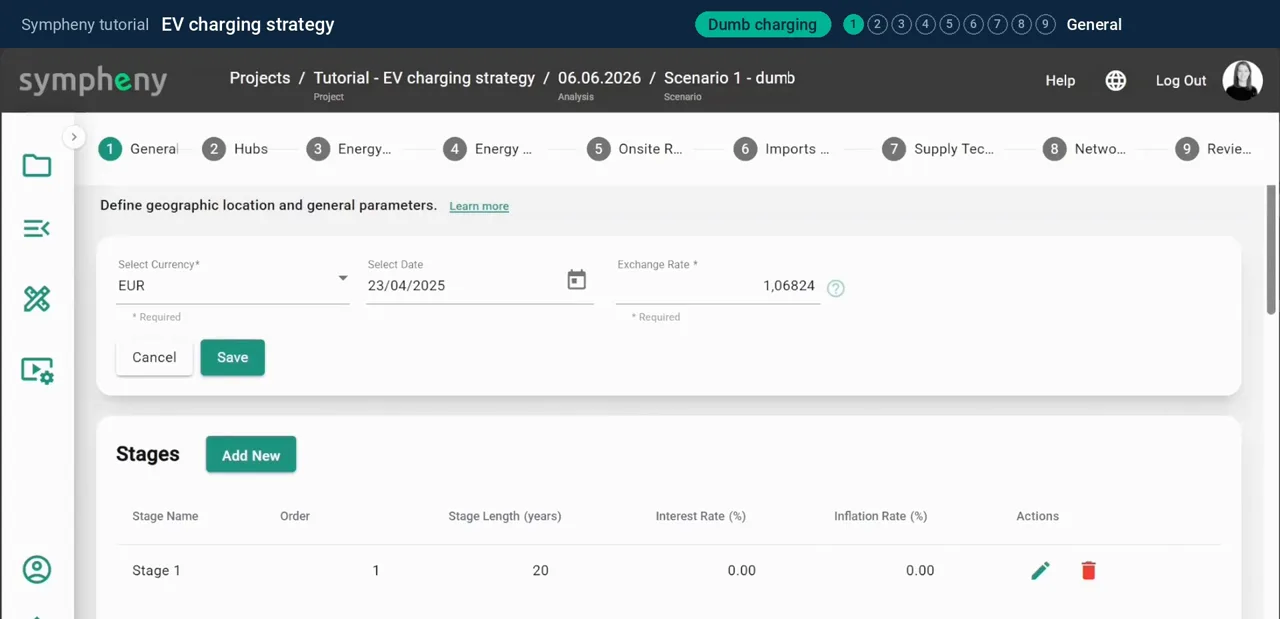
Open the first scenario, Dumb charging, and start with step 1, General. Choose your currency (here EUR) and add a stage: the period you plan for. This project has one stage, Stage 1, with a length of 20 years.
The interest rate is left at 0 to keep the comparison simple. In a real study, use your own rate.
In the documentation: General step ↗
- 2
Step 2, Hubs: one place where energy is used
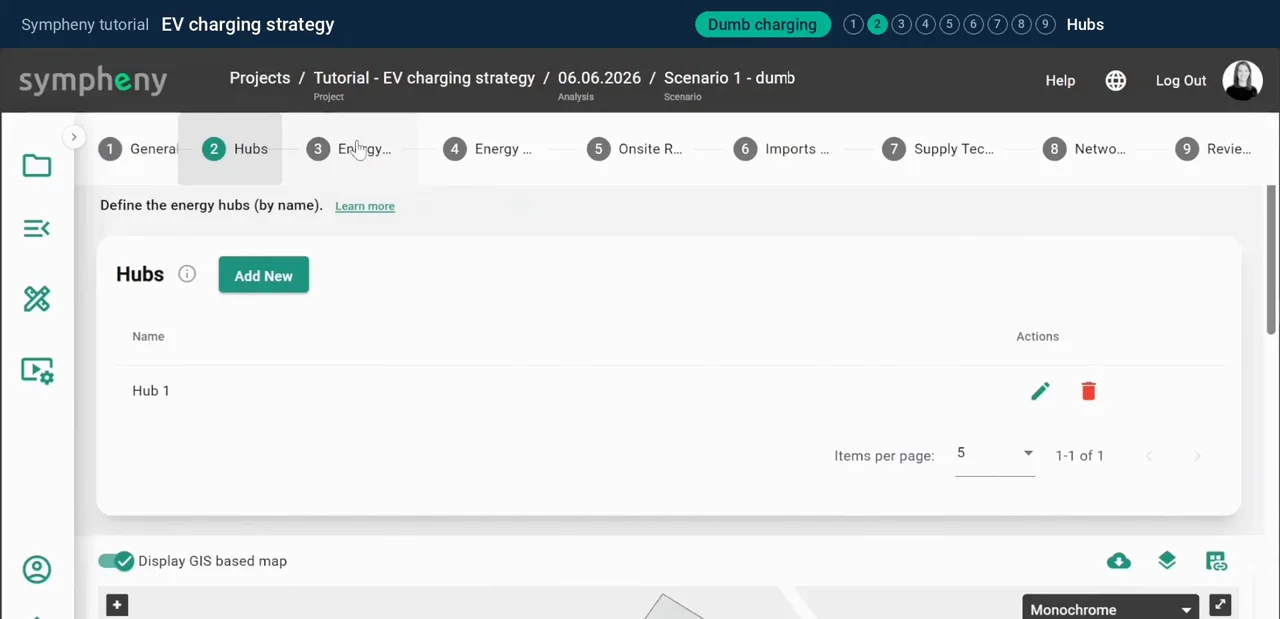
In step 2, Hubs, you define the places where energy is converted and used. One hub, Hub 1, is enough for this site.
In the documentation: Hubs step ↗
- 3
Step 3, Energy Carriers: electricity, roof solar and the EV load
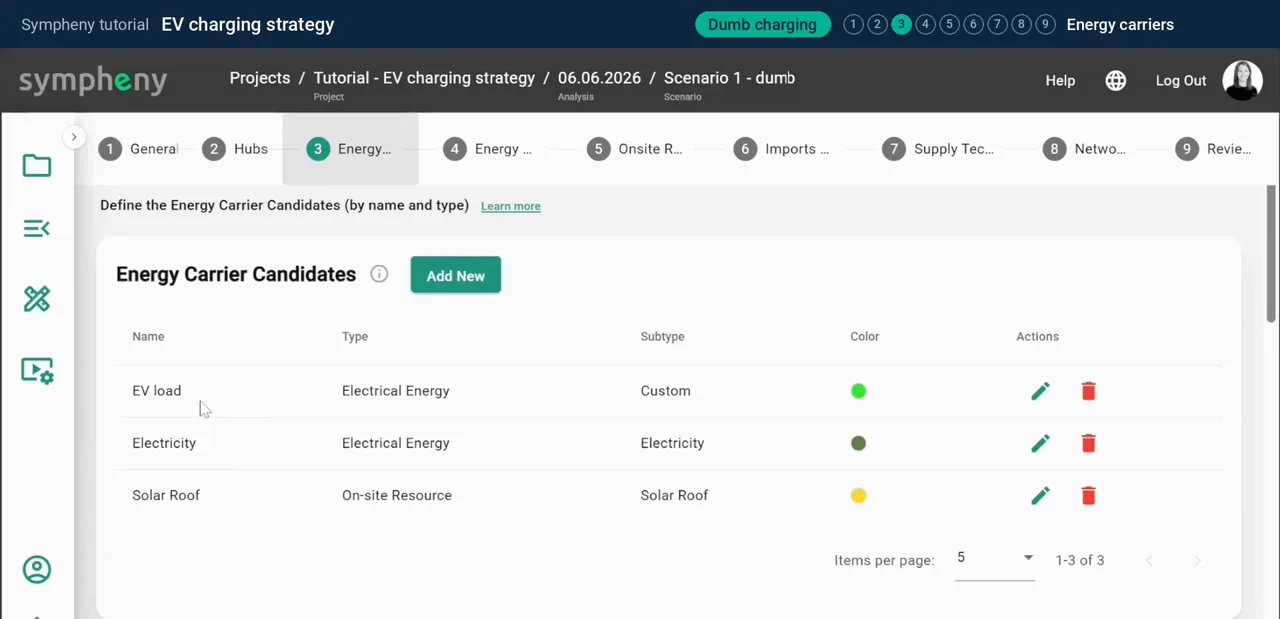
In step 3, Energy carriers, click Add New for each form of energy in the system: Electricity, Solar Roof (the solar resource on your roof) and a separate carrier for the vans, EV load.
Keeping the vans' electricity separate lets you put a charger, with its own cost, between the grid and the vans.
In the documentation: Energy carriers step ↗
- 4
Step 4, Energy Demands: the building and the vans
In step 4, Energy demands, click Add New, choose the carrier and give it an hourly profile.
For the building, let Sympheny's database generate the profile: here, an office building of about 1,000 m².
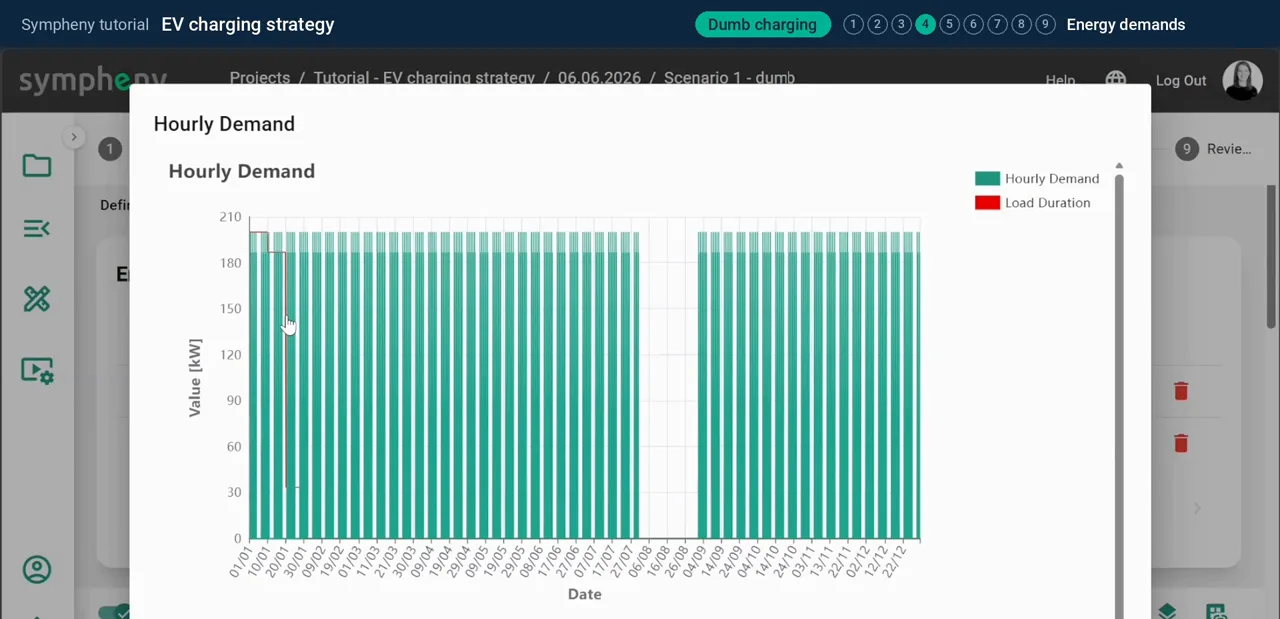
For the EV load, upload your own hourly profile. With dumb charging, the vans draw as much power as they can the moment they're plugged in: at lunch, and again at the end of the day. You can also see the summer break in August, when the vans aren't used. Sympheny can generate more varied profiles too, but an uploaded profile gives you full control over the charging hours.
In the documentation: Energy demands step ↗
- 5
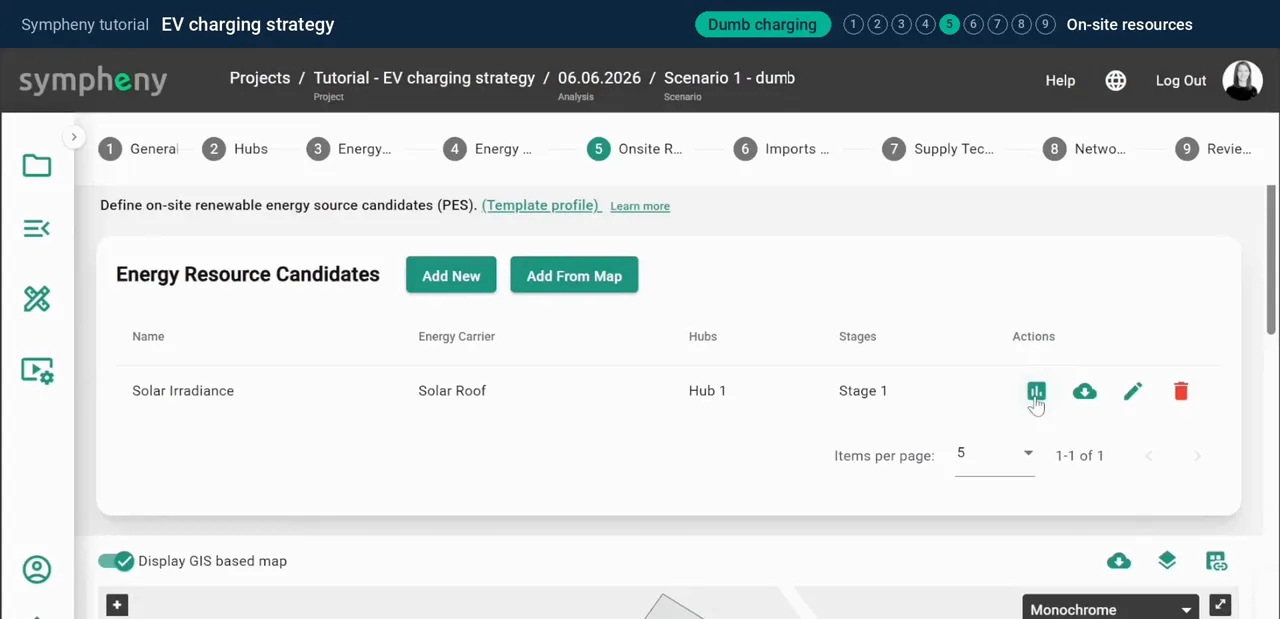
Step 5, Onsite Resources: the roof
In step 5, On-site resources, add the solar on your roof, here about 1,000 m². Sympheny generates the hourly solar profile from the roof's orientation, tilt and location.
In the documentation: On-site resources step ↗
- 6
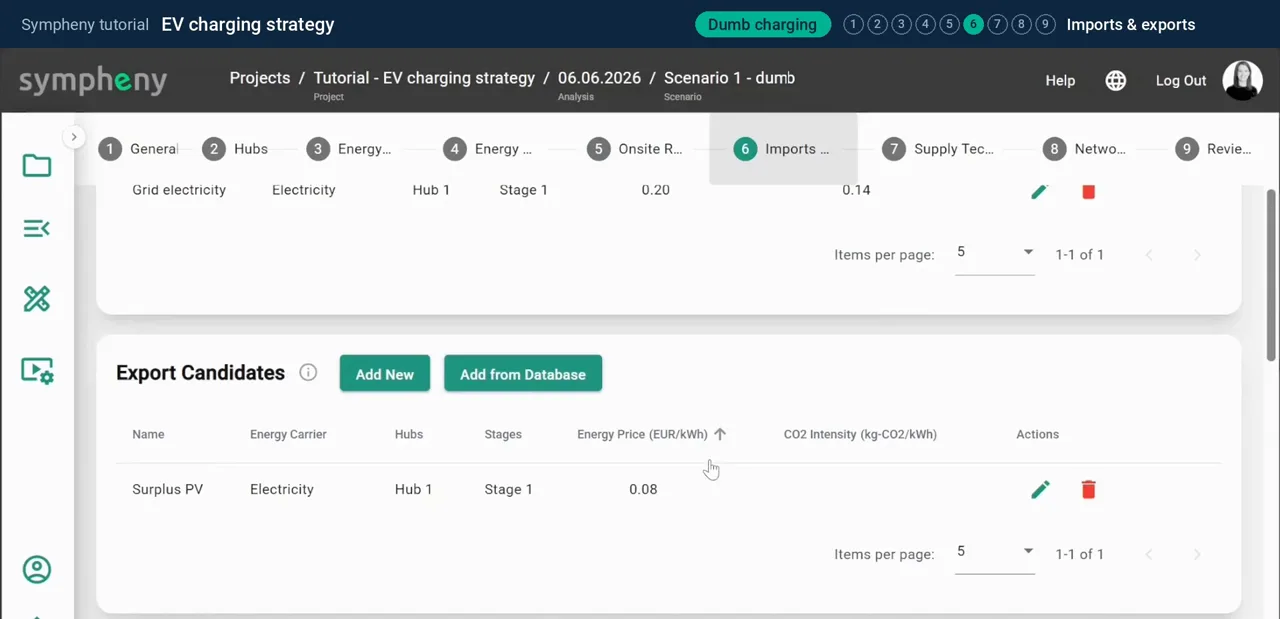
Step 6, Imports & Exports: grid prices
In step 6, Imports and exports, you buy electricity from the grid at 0.20 EUR/kWh and sell surplus solar for 0.08 EUR/kWh. That gap is why using your own solar pays off.
In the documentation: Imports & exports step ↗
- 7
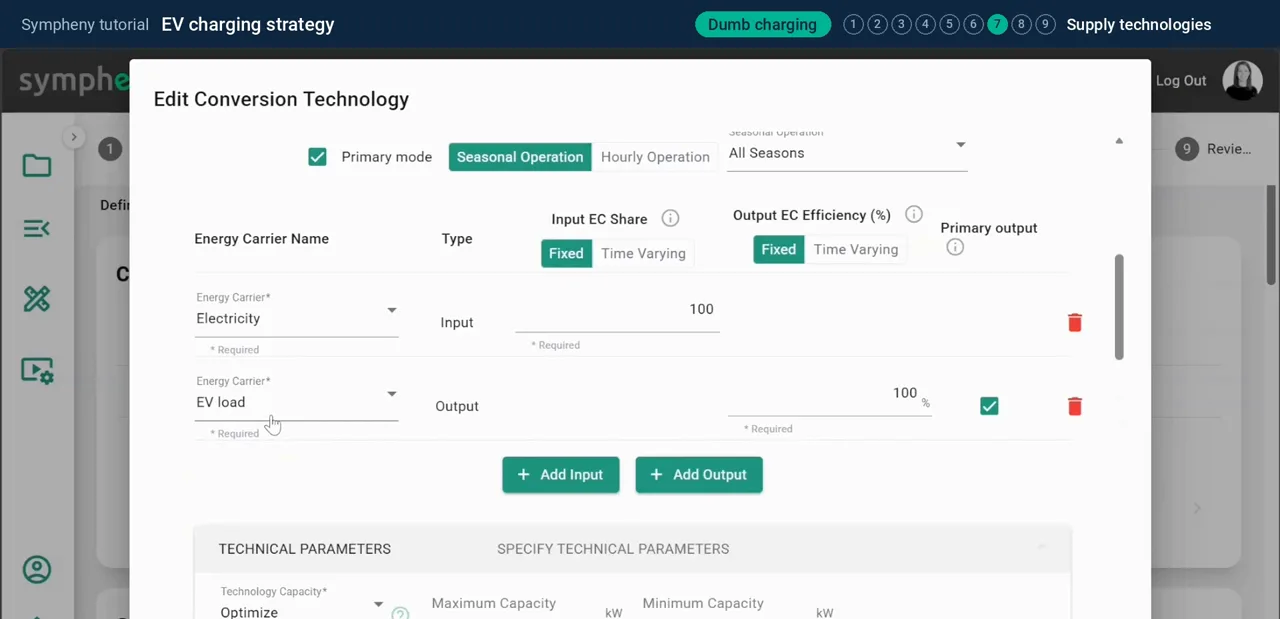
Step 7, Supply Technologies: solar, a battery and an EV charger
In step 7, Supply technologies, add solar panels and a battery straight from Sympheny's technology database.
For the charger, create a custom technology, EV charger: Electricity in, EV load out, at 100 % efficiency, with an investment cost of 5,000 EUR plus 100 EUR per kW.
In the documentation: Supply technologies step ↗
- 8
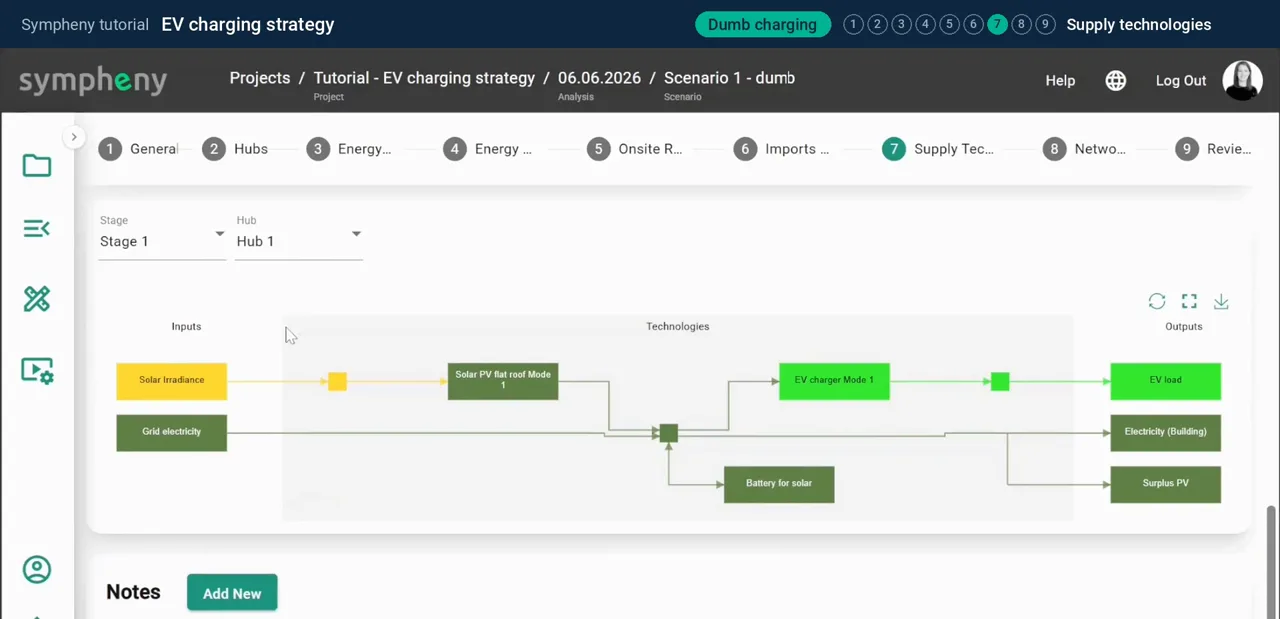
Check the energy diagram
Below the technologies, the energy diagram shows your system. Solar and the grid supply electricity, and the battery can store it. Electricity serves the building, surplus solar is exported, and the charger feeds the vans.
You can skip steps 8 and 9, Network Links and Review setup, here: networks only matter when you connect several hubs.
In the documentation: Supply technologies step ↗
- 9
Run the optimisation
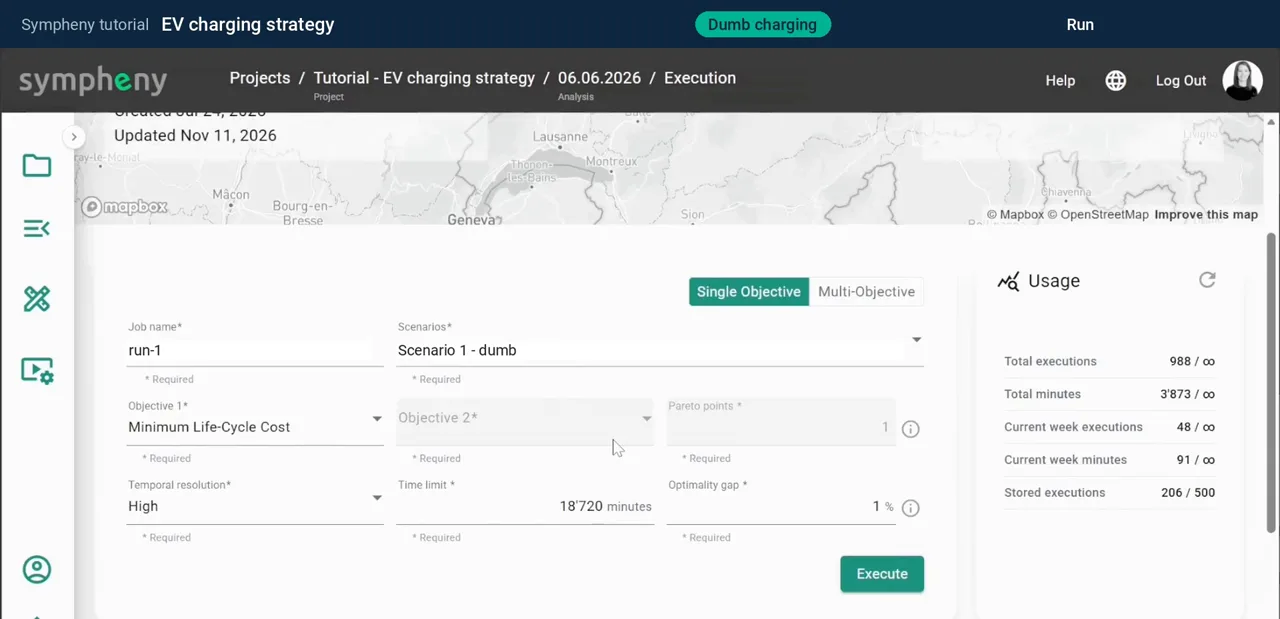
Click Execution Options, keep Minimum Life-Cycle Cost as the objective and click Execute. A run like this takes a few seconds.
In the documentation: Execution ↗
- 10
Read the results for dumb charging
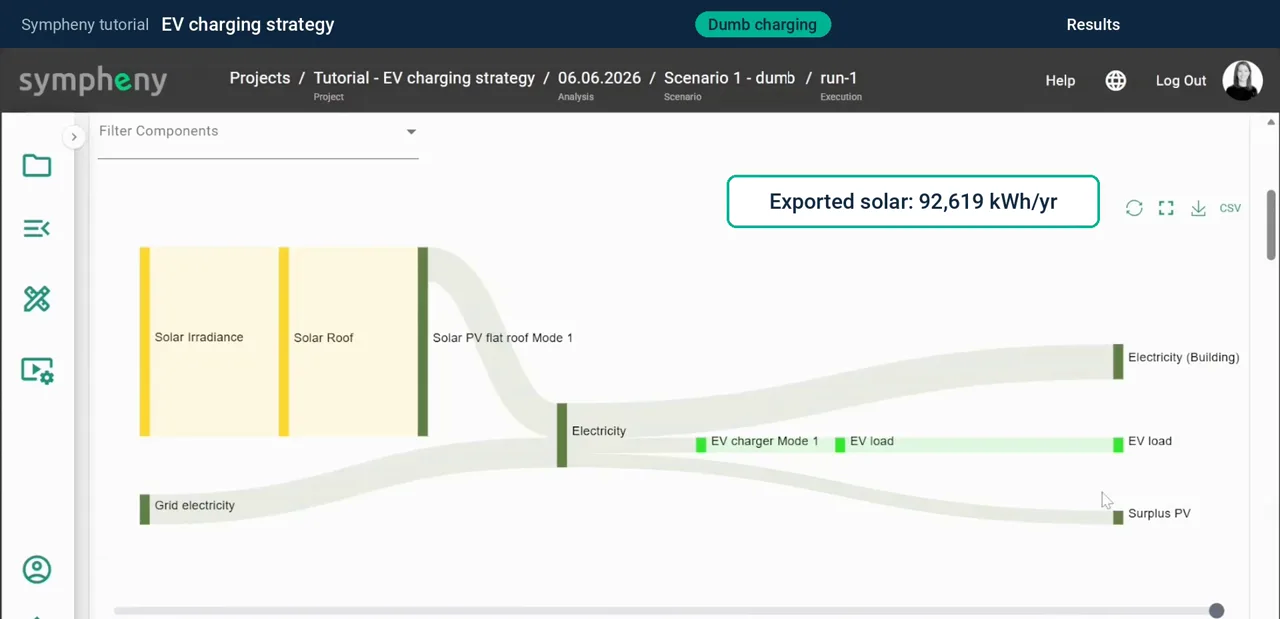
In the results, the Sankey diagram shows where the energy goes. About 92,600 kWh of solar is exported each year. Keep that number in mind.
Notice what's missing: there is no stationary battery. The optimiser decided it isn't worth building.
In the documentation: Results dashboard ↗
- 11
Copy the scenario for smart charging
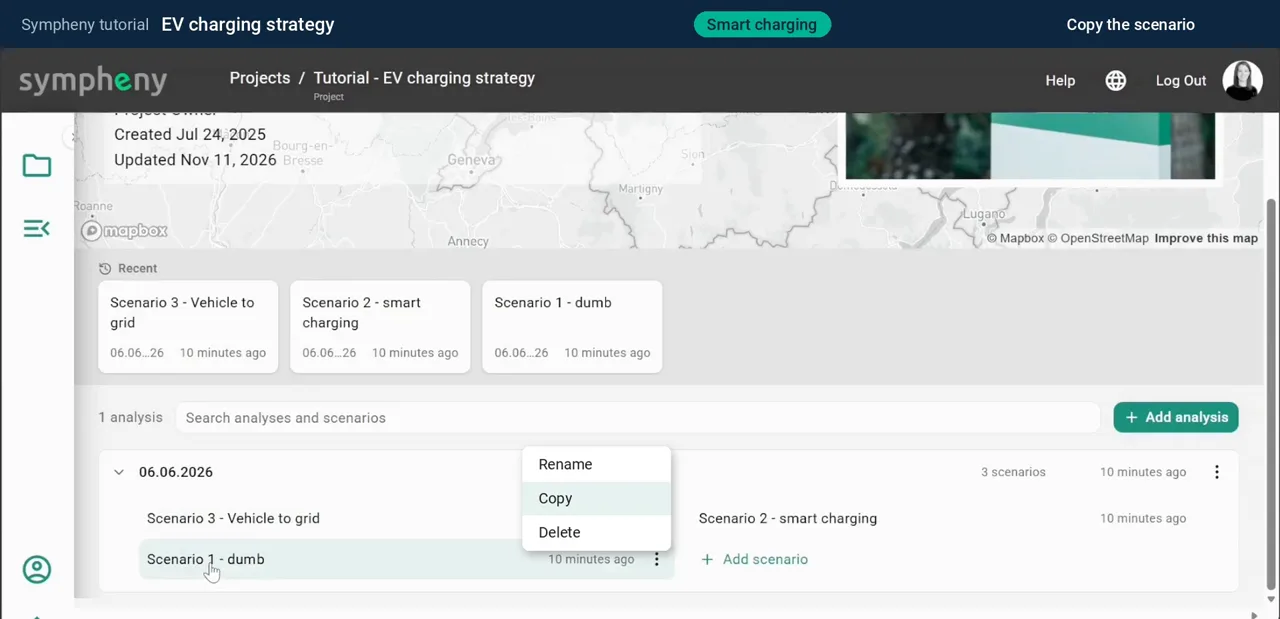
For smart charging, copy the first scenario: open its menu and click Copy. Three things change: the EV load, a new EV battery, and a time limit on the charger.
In the documentation: Analyses and scenarios ↗
- 12
Change the EV load to driving consumption
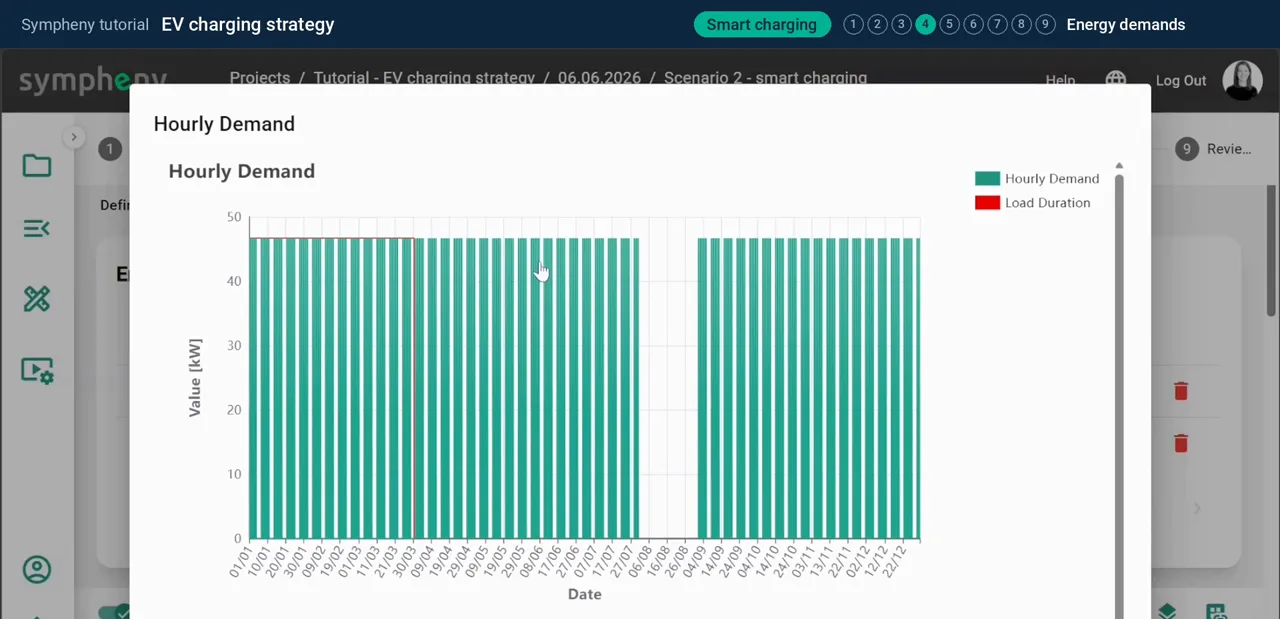
In Energy demands, the EV load now becomes the energy the vans use while driving: up to about 47 kW for the fleet, from 08:00 to 12:00 and from 13:00 to 17:00 on working days.
In the documentation: Energy demands step ↗
- 13
Add the vans' batteries as storage
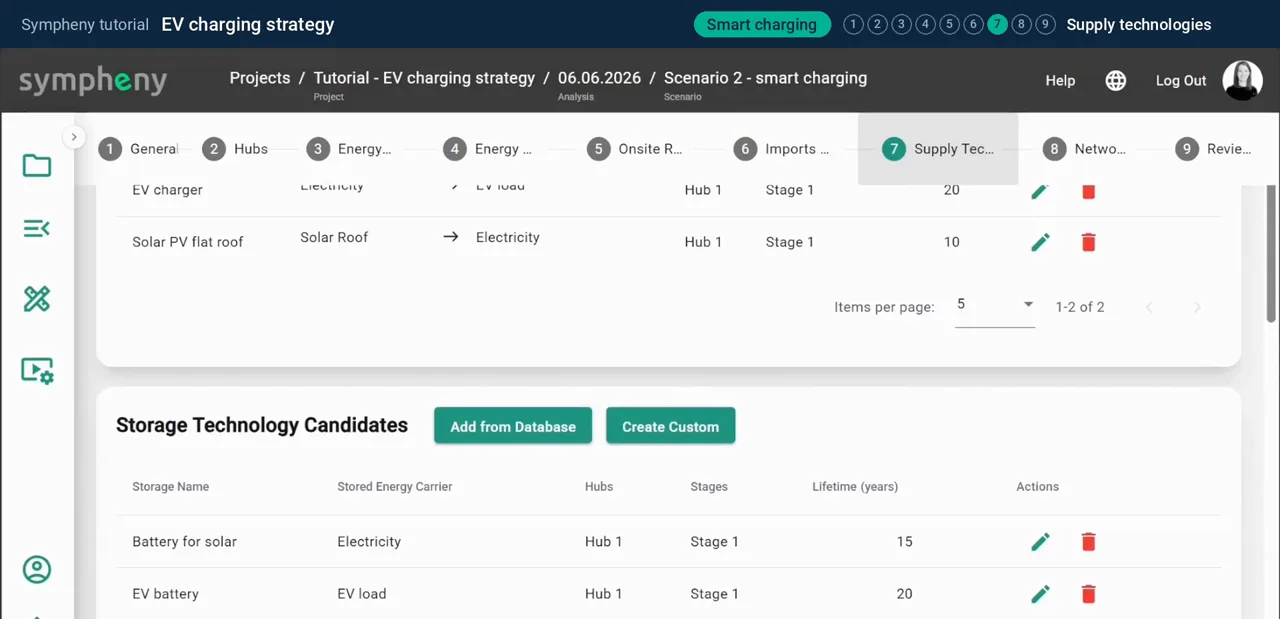
In Supply technologies, under Storage Technology Candidates, click Create Custom and add storage for the vans' own batteries: EV battery, on the EV load carrier.
In the documentation: Supply technologies step ↗ Storage technologies ↗
- 14
Limit the charger to the parked hours
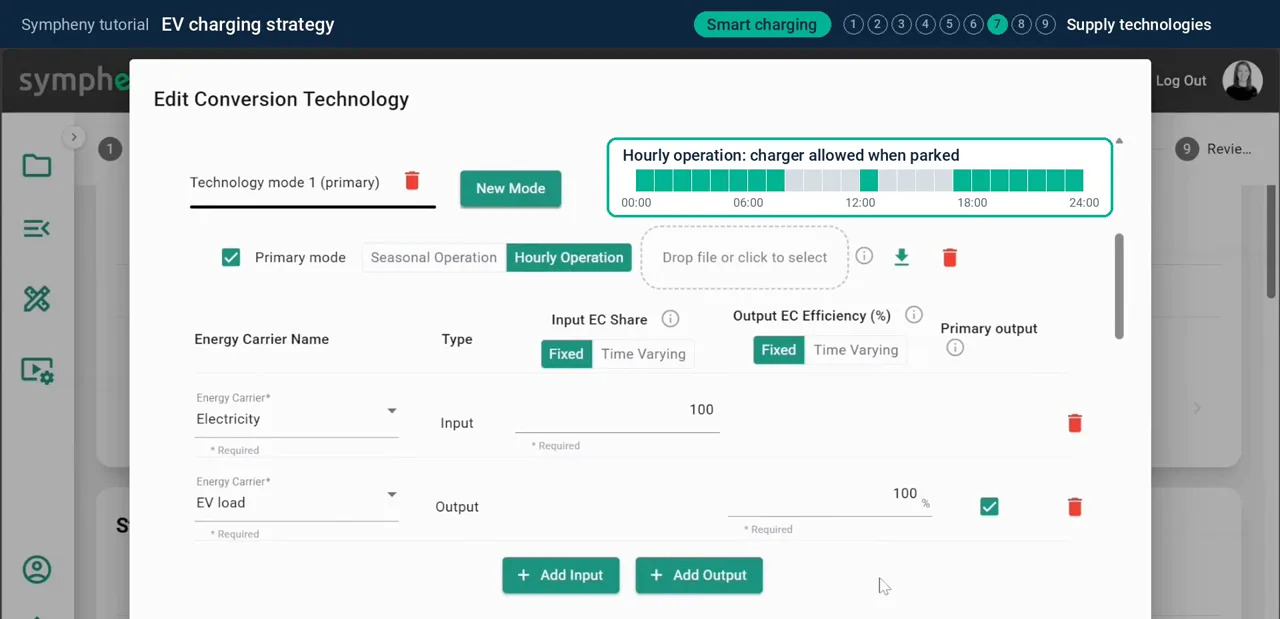
Open the EV charger and give it an hourly operation profile, so it can only run while the vans are parked: over lunch, and from 17:00 until 08:00.
Now the model decides when to charge, and the vans' batteries cover the driving hours. In the energy diagram, the EV battery sits between the charger and the EV load.
In the documentation: Supply technologies step ↗
- 15
Run smart charging and compare
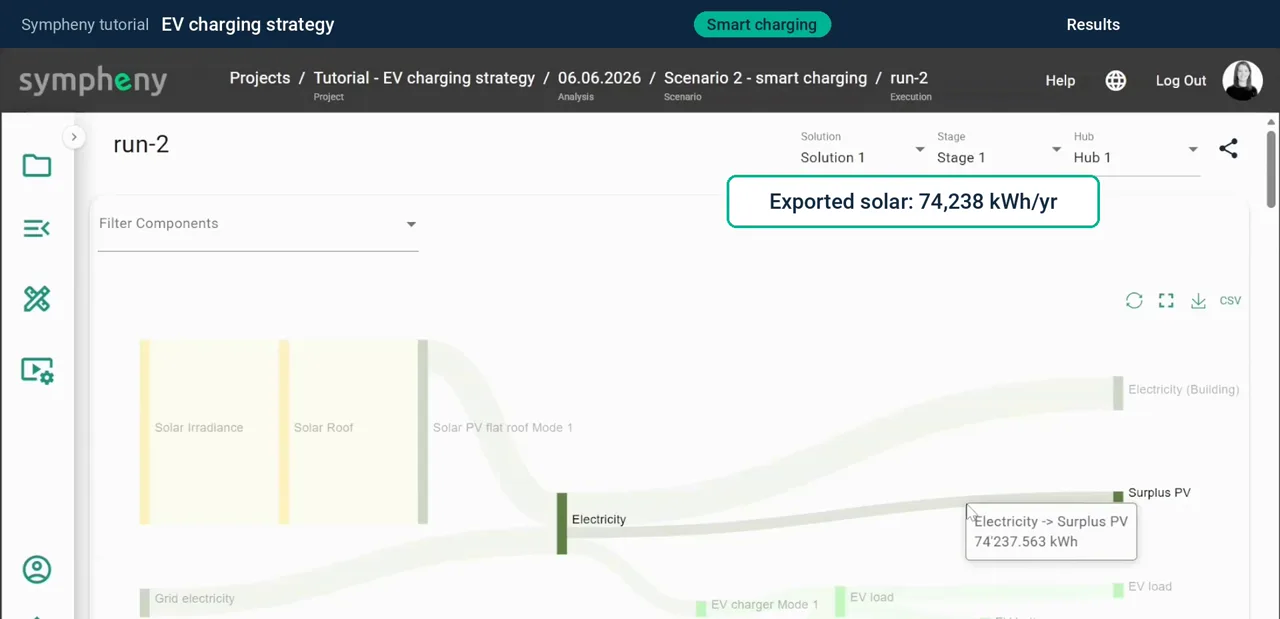
Run the scenario. Exported solar drops to about 74,200 kWh: 20 % less, with the same demand and the same roof.
In the documentation: Execution ↗ Results dashboard ↗
- 16
Check when the vans charge
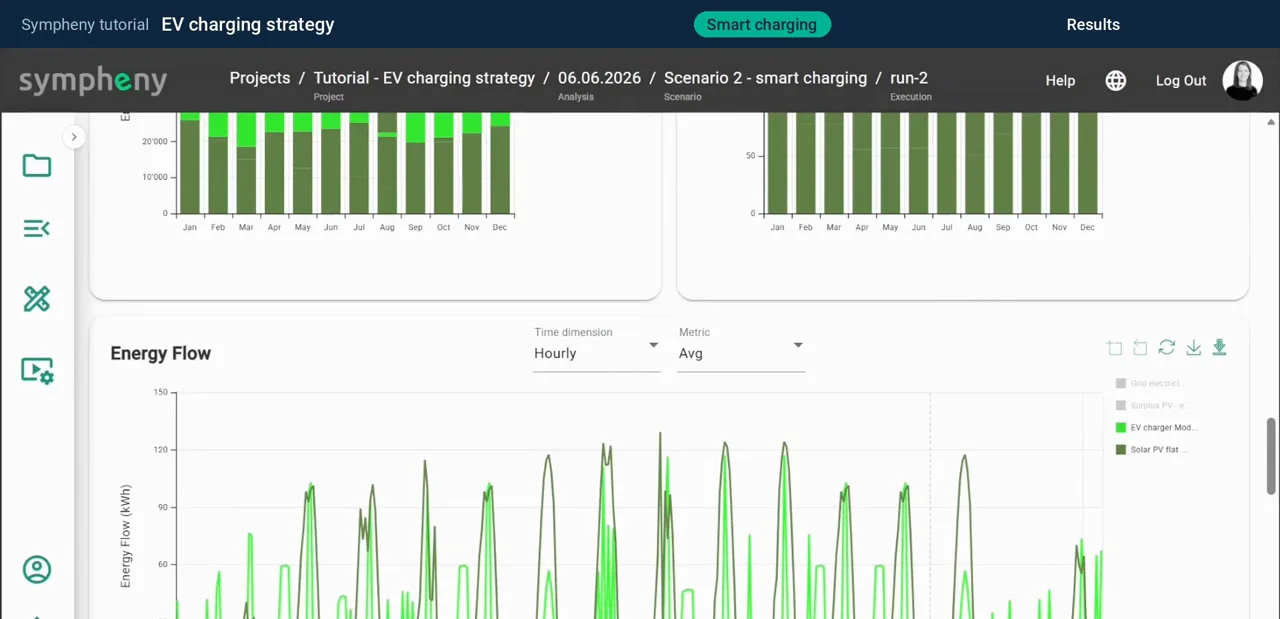
The energy flow charts show every hour of the year, so you can check when the vans actually charge.
In the documentation: Results dashboard ↗
- 17
Vehicle-to-grid: give the charger a second mode
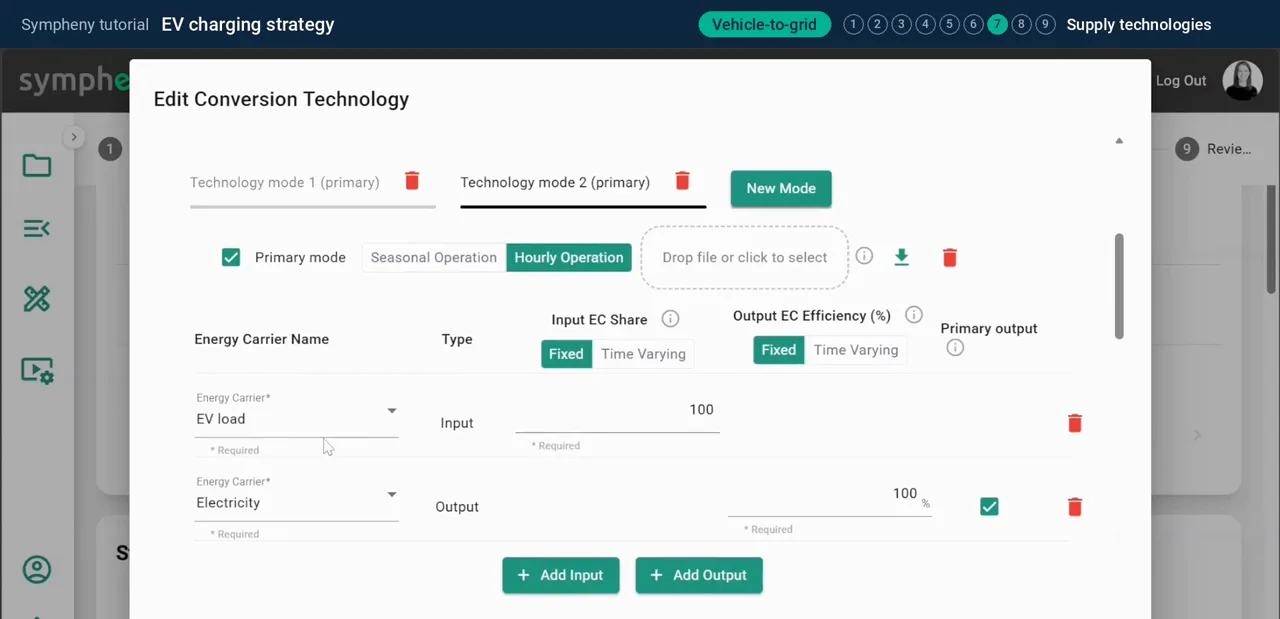
For vehicle-to-grid, copy Smart charging the same way. Only one thing changes: the EV charger gets a second operating mode, for discharging.
Open the EV charger and click New Mode. Mode 1 charges the vans. Mode 2 discharges them (EV load in, Electricity out), so the vans' batteries can feed electricity back. The same hourly limit applies.
In the documentation: Supply technologies step ↗
- 18
Run vehicle-to-grid
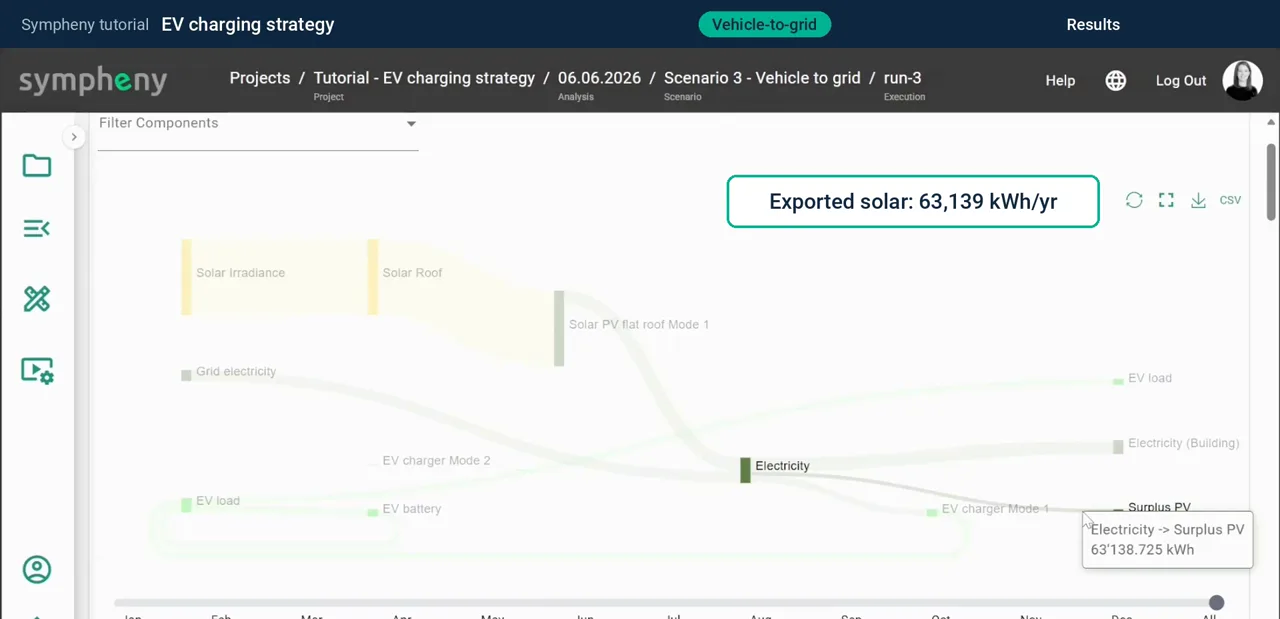
In the Sankey diagram there is now a second loop: electricity flows from the vans' batteries back into the system.
Exported solar drops again, to about 63,100 kWh. That's another gain, but a smaller one than the step from dumb to smart charging.
In the documentation: Execution ↗
- 19
Compare the three strategies
Compared with dumb charging, smart charging cuts exported solar by a fifth and vehicle-to-grid by about a third. The stationary battery isn't built in any scenario: at these prices, it doesn't pay off.
Now try it yourself: change a value, such as the grid price or the charging hours, run it again and see what moves. To compare costs and CO₂, open the results dashboard.
In the documentation: Results dashboard ↗
Results
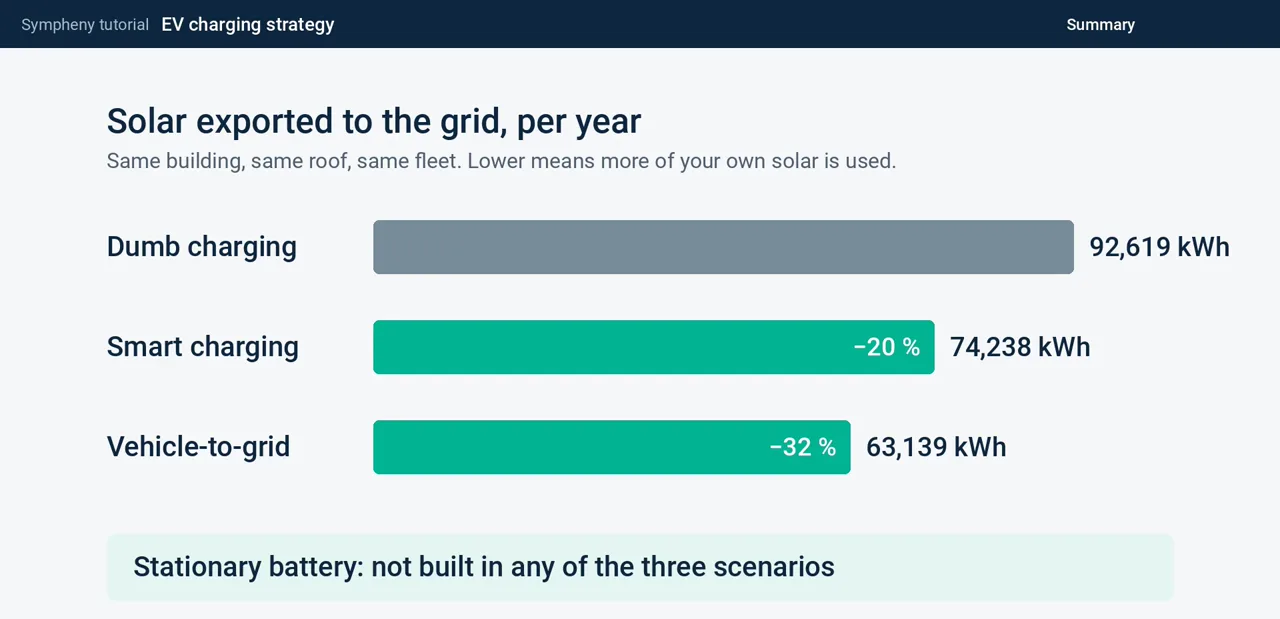
Same building, same roof, same fleet. Lower exported solar means more of your own solar is used on site.
| Strategy | Solar exported (kWh/year) | Change vs dumb charging |
|---|---|---|
| Dumb charging | 92,619 | – |
| Smart charging | 74,238 | −20 % |
| Vehicle-to-grid | 63,139 | −32 % |
- Smart charging makes the biggest difference: it cuts exported solar by a fifth.
- Vehicle-to-grid adds a further, smaller gain, about a third less export than dumb charging.
- The stationary battery is not built in any of the three scenarios at these prices.
- This tutorial compares exported solar only; open the results dashboard to compare costs and CO₂.
Try it yourself
Build the model alongside the video in your own Sympheny account, then change one assumption and run it again.
Stuck on a step? Ask our support team. Tell us which tutorial and step, and we'll help you get unstuck. Contact support ↗
Video transcript
A company is replacing its fleet with ten electric vans. They drive from eight to twelve and from one to five, and they're parked over lunch and overnight.
On the roof, there's solar, which peaks around midday.
With dumb charging, the vans charge at full power the moment they're plugged in: at noon, and again at five.
With smart charging, the same energy is spread over the parked hours, using as much solar as possible.
And with vehicle-to-grid, the vans' batteries can also give electricity back.
Which strategy uses the most of your own solar? And is a stationary battery worth the investment? Let's find out.
Here's the project, with one scenario per strategy. To build your own, you go through the same nine steps. Let's start with dumb charging.
Step one, General. Choose your currency, here euros, and add a stage: the period you plan for. Here, one stage of 20 years.
We've left the interest rate at zero to keep the comparison simple. In a real study, use your own.
Step two, Hubs. A hub is a place where energy is converted and used. One hub is enough here.
Step three, Energy carriers: the forms of energy in your system. Click Add New for each one: electricity, the solar on your roof, and a separate carrier for the vans, the EV load.
Keeping the vans' electricity separate lets you put a charger, with its own cost, between the grid and the vans.
Step four, Energy demands. Click Add New, choose the carrier, and give it an hourly profile.
For the building, Sympheny's database generates the profile: here, an office building of about 1,000 square metres.
For the EV load, upload your own hourly profile. With dumb charging, the vans draw as much power as they can the moment they're plugged in: at lunch, and again at the end of the day.
You can also see the summer break in August, when the vans aren't used.
Sympheny can also generate more varied profiles, but here we wanted full control over the charging hours.
Step five, On-site resources. Add the solar on your roof, here about 1,000 square metres. Sympheny generates the hourly solar profile for its orientation, tilt and location.
Step six, Imports and exports. You buy electricity from the grid at 20 cents per kilowatt-hour and sell surplus solar for 8. That gap is why using your own solar pays off.
Step seven, Supply technologies. Add solar panels and a battery straight from Sympheny's technology database.
For the EV charger, create a custom technology: electricity in, EV load out, at 100 percent efficiency, with an investment cost of 5,000 euros plus 100 euros per kilowatt.
Below, the energy diagram shows your system. Solar and the grid supply electricity, and the battery can store it.
Electricity serves the building, surplus solar is exported, and the charger feeds the vans.
Steps eight and nine, Networks and Review, you can skip here: networks only matter when you connect several hubs.
Now click Execution Options, keep minimum cost as the objective, and run it. A run like this takes a few seconds.
In the results, the Sankey diagram shows where the energy goes. About 93,000 kilowatt-hours of solar are exported each year. Keep that number in mind.
And notice what's missing: there's no stationary battery. The optimiser decided it isn't worth building.
For smart charging, copy the first scenario: open its menu and click Copy.
Three things change: the EV load, a new EV battery, and a time limit on the charger.
First, in Energy demands, the EV load becomes the energy the vans use while driving: up to about 47 kilowatts for the fleet, from eight to twelve and from one to five on working days.
Second, in Supply technologies, create a custom storage for the vans' own batteries: the EV battery.
Then give the charger an hourly operation profile, so it can only run while the vans are parked: over lunch, and from five in the evening until eight in the morning.
Now the model decides when to charge, and the vans' batteries cover the driving hours.
The diagram now has the EV battery between the charger and the EV load.
Run it, and exported solar drops to about 74,000 kilowatt-hours: 20 percent less, with the same demand and the same roof.
The energy flow charts show every hour of the year, so you can check when the vans charge.
For vehicle-to-grid, copy smart charging the same way.
One thing changes: the EV charger gets a second mode, for discharging.
Click New Mode to give it a second operating mode. Mode one charges the vans. Mode two discharges them, so the vans' batteries feed electricity back. The same hourly limit applies.
In the Sankey diagram, there's now a second loop: electricity flows from the vans' batteries back into the system.
Exported solar drops again, to about 63,000 kilowatt-hours. Another gain, but a smaller one than the step from dumb to smart charging.
To sum up: compared with dumb charging, smart charging cuts exported solar by a fifth, and vehicle-to-grid by about a third.
And the stationary battery isn't built in any scenario. At these prices, it doesn't pay off.
Now it's your turn. Change a value, like the grid price or the charging hours, run it again, and see what moves.
To compare costs and CO₂, open the results dashboard. And to model your own site, start a new project and follow the same nine steps.