The story
A data centre near Geneva uses 1.2 GWh of electricity a year, day and night. On a sunny day, solar panels on its 10,000 m² roof would produce far more than it needs at noon and nothing after dark. So the surplus goes to the grid, and at night the grid supplies everything.
Could a battery help? Most people expect it to pay by storing midday solar for the evening. The question here: is a battery worth the investment?
You build one model from scratch and compare two scenarios: solar only (No battery), and the same system with a 100 kWh battery. Inputs: the data centre's hourly electricity demand, a solar profile for the roof, grid prices with a CO₂ intensity and a capacity charge, an export price for surplus solar, and solar panels and a battery from Sympheny's technology database.
Step by step
Follow along in Sympheny. Each step has a screenshot from the video; click the time under it to watch that moment.
- 1
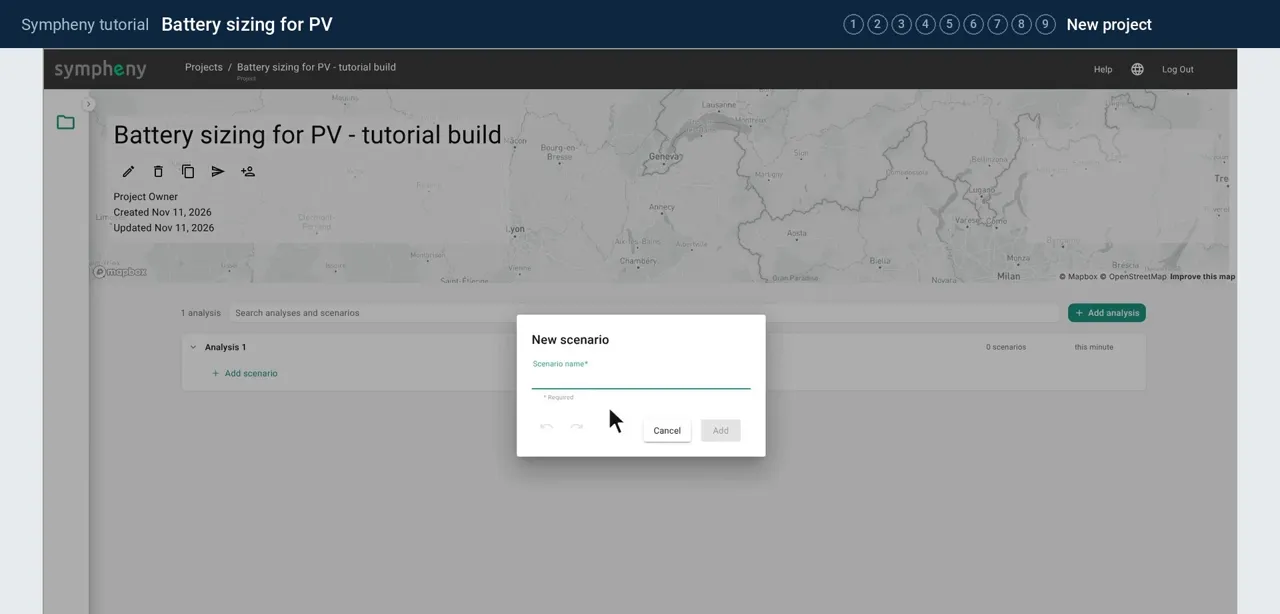
Create the project and a first scenario
On the projects page, click the plus, give the project a name and click on the map to place it. Here it sits near Geneva.
Open the project and add a first scenario. Call it No battery: it will hold solar panels, the grid and the data centre, nothing else.
In the documentation: Projects ↗
- 2
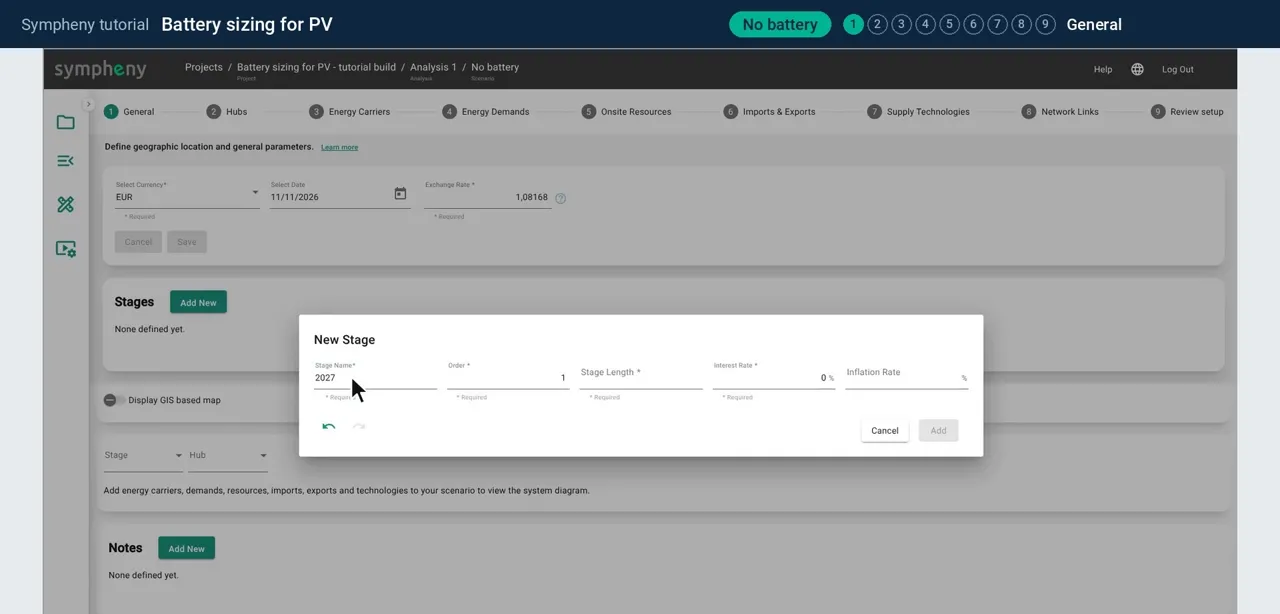
Step 1, General: currency and stage
Choose EUR as the currency. Then add a stage: the period you plan for. This one starts in 2027 and runs for 20 years.
The interest rate stays at 0 % to keep the comparison simple. In a real study, use your own.
In the documentation: General step ↗ Stages ↗
- 3
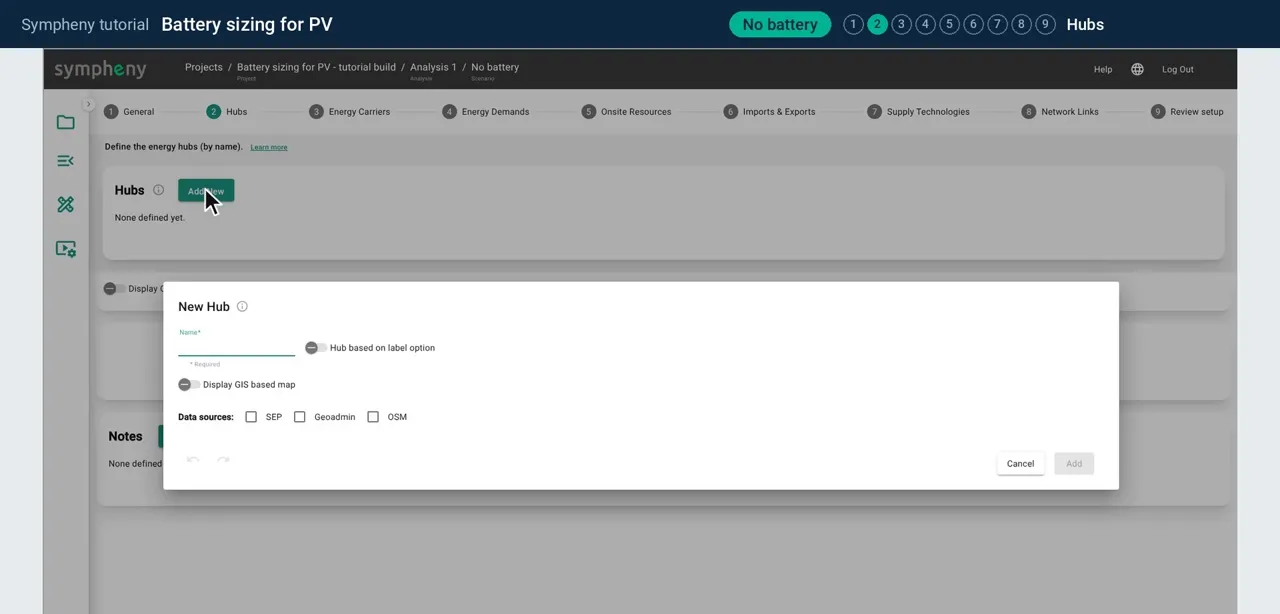
Step 2, Hubs: one data centre
A hub is a place where energy is converted, stored and used. This model needs only one: add a hub called Data centre.
In the documentation: Hubs step ↗
- 4
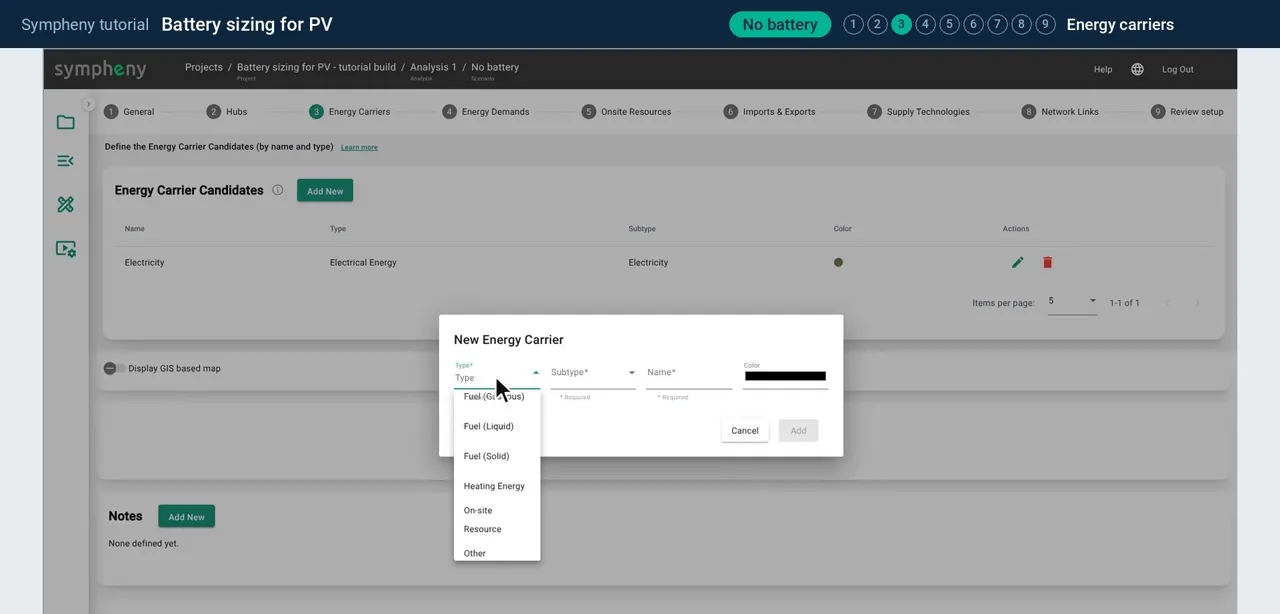
Step 3, Energy Carriers
Energy carriers are the forms of energy in the system. Add two: Electricity, and Solar Roof (the sunlight falling on the roof). You need both before steps 4 and 5.
In the documentation: Energy carriers step ↗
- 5
Step 4, Energy Demands: the data centre's load
Click Add New, choose Electricity and name the demand, for example Data centre electricity.
For the hourly profile, choose Upload profile and drop in a file with one value for every hour of the year. We prepared one for this data centre.
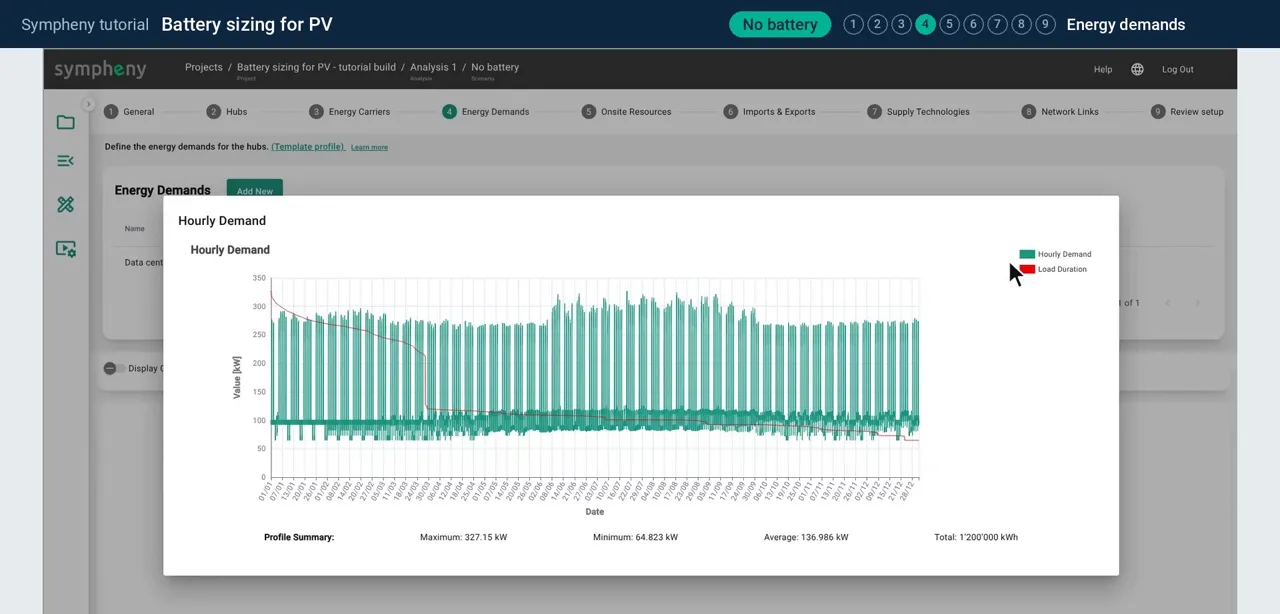
Open the chart to check it: 1.2 GWh a year, between about 65 and 330 kW.
In the documentation: Energy demands step ↗
- 6
Step 5, Onsite Resources: the solar roof
Add the Solar Roof resource with an area of 10,000 m².
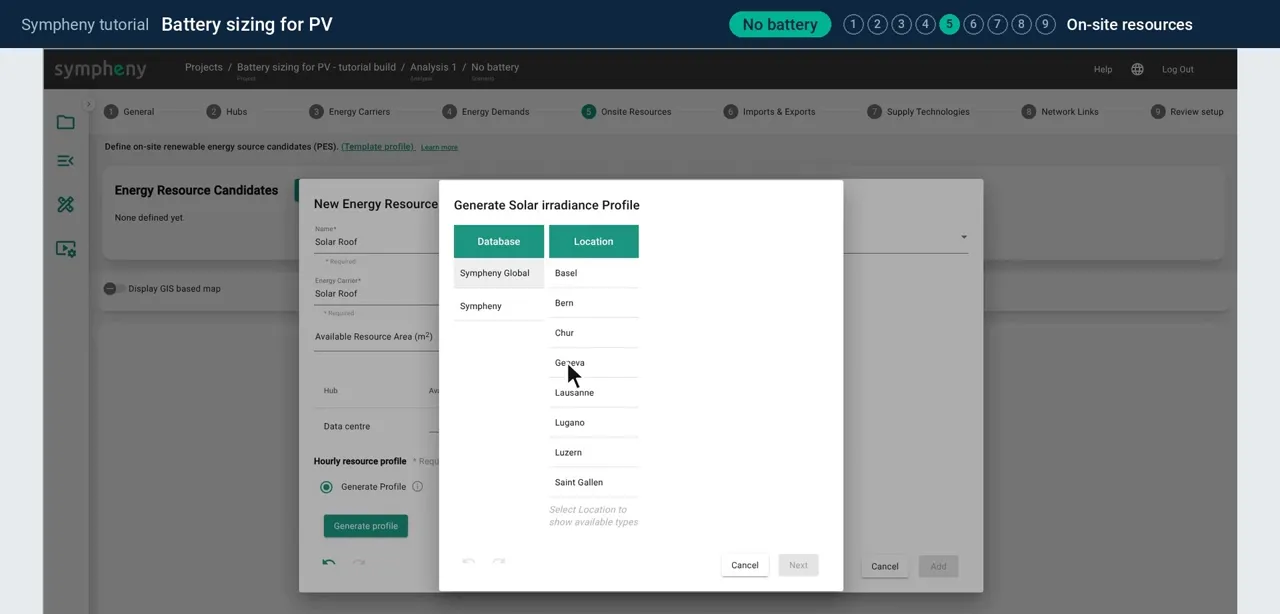
Click Generate profile and pick Geneva, Roof, 15° tilt, facing east. To keep it simple, the whole roof can be used and there are no extra losses.
In the documentation: On-site resources step ↗
- 7
Step 6, Imports & Exports
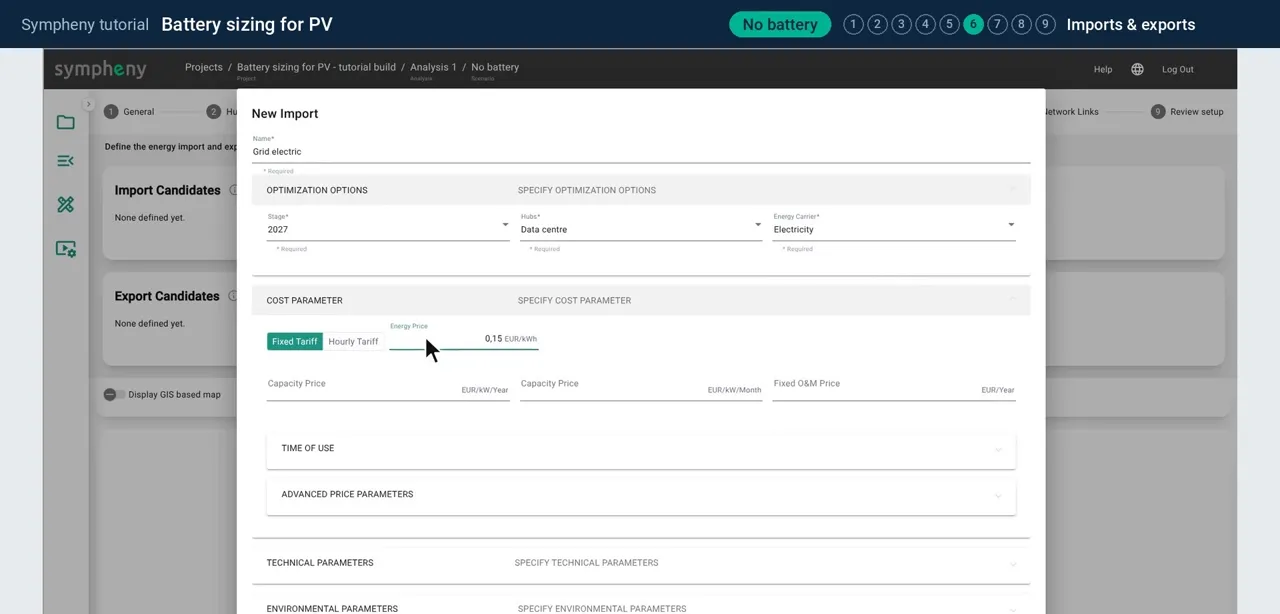
Add an import called Grid electricity: 0.15 EUR/kWh, with a CO₂ intensity of 0.2 kg/kWh.
Also set its capacity price: 10 EUR per kW of peak demand per year. This charge turns out to matter for the battery.
Then add an export called Surplus solar, sold at 0.08 EUR/kWh.
In the documentation: Imports & exports step ↗
- 8
Step 7, Supply Technologies: solar panels
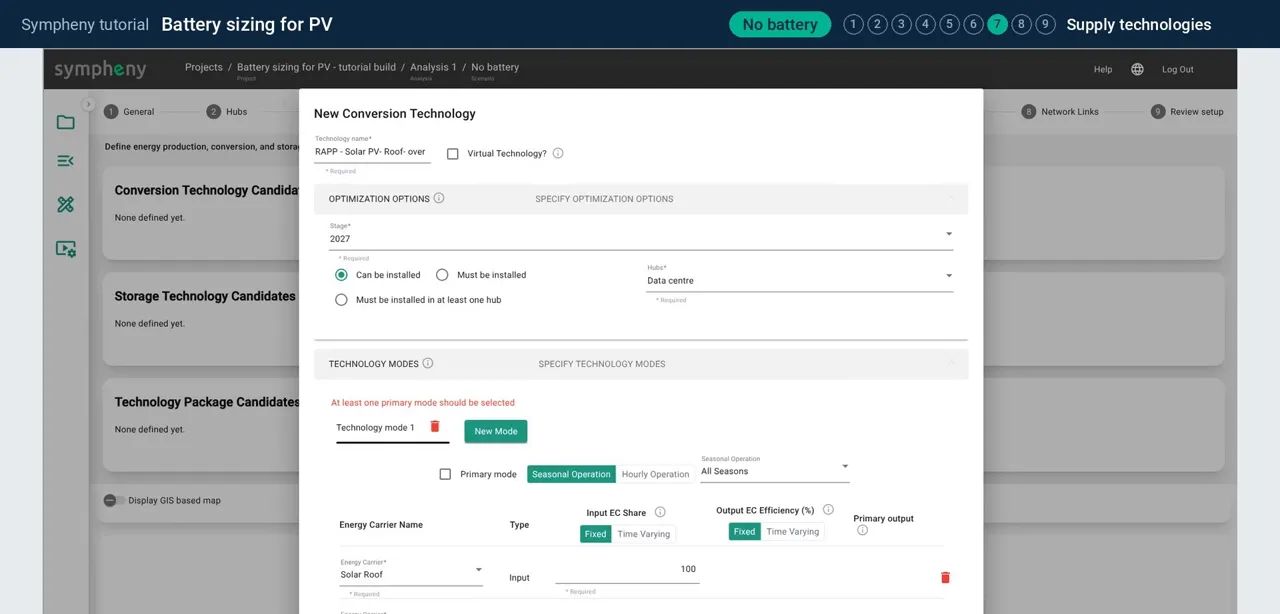
Under conversion technologies, click Add from Database and choose the roof solar panels for systems over 100 kW. Costs and an 18 % efficiency come with the entry.
Rename it Solar PV, tick Primary mode and set the capacity to Optimize, so Sympheny decides how much to build.
In the documentation: Supply technologies step ↗
- 9
Steps 8 and 9, Network Links and Review setup: check, then run
Step 8 is for networks between hubs; with one hub you don't need it. Step 9 shows the whole system as a diagram, so check that everything is connected.
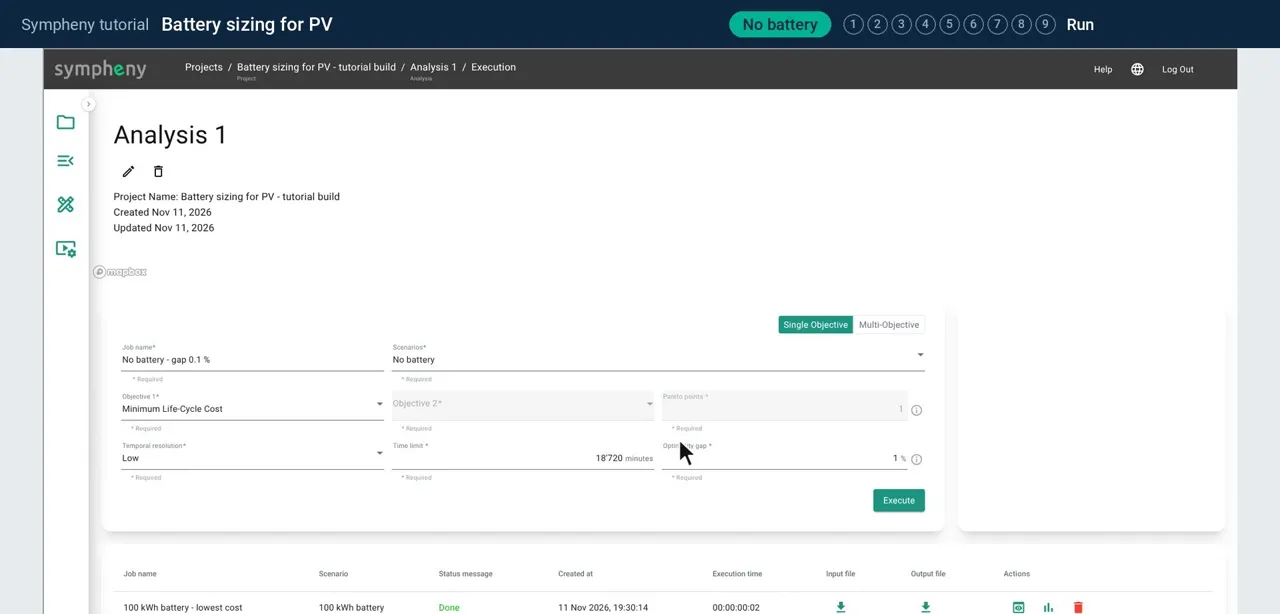
Click Execution Options, name the run, pick the No battery scenario and minimise life-cycle cost. Set the optimality gap to 0.1 % for a precise answer, then click Execute. The run takes less than a minute.
In the documentation: Network links step ↗ Execution ↗
- 10
Read the life-cycle cost
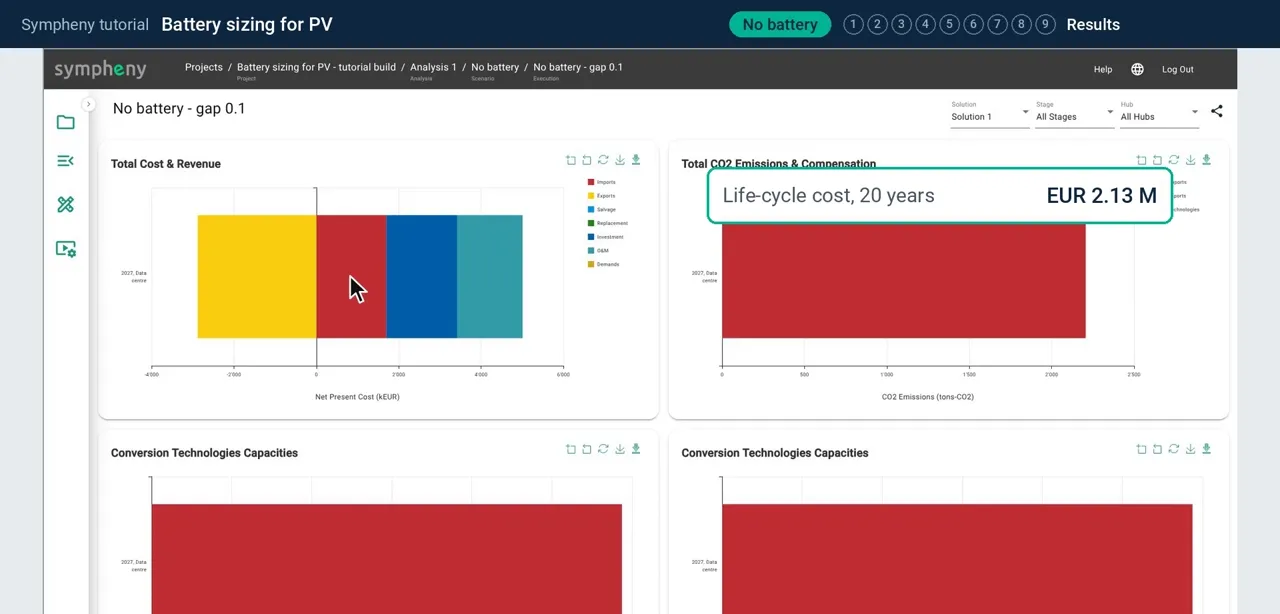
Open the results. The cost chart adds up investment, replacements, maintenance and grid costs over 20 years, minus export income. Without a battery, the life-cycle cost is EUR 2.13 million.
In the documentation: Results dashboard ↗
- 11
Follow the energy in the Sankey diagram
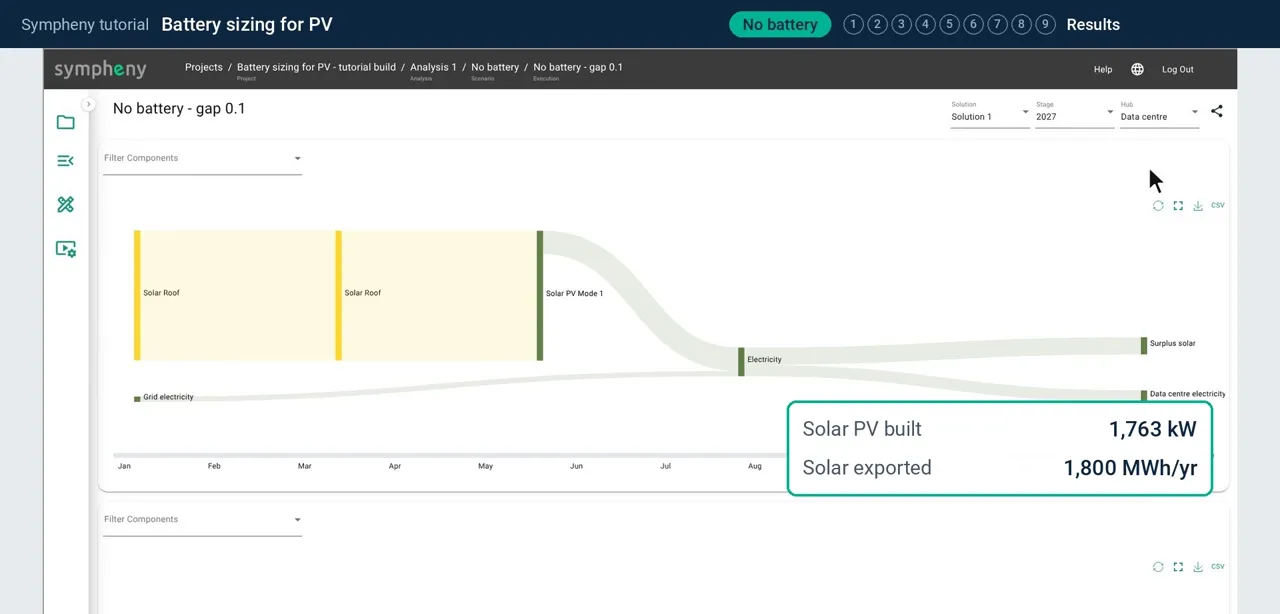
The Sankey diagram shows where the energy goes: the wider the band, the more energy.
Sympheny covers the whole roof, about 1,760 kW of solar. Almost three quarters of the output is exported, 1.8 GWh a year, and the grid still supplies about 550 MWh a year, mostly at night.
Why the whole roof? Over 20 years each solar kWh costs about 7 cents including maintenance, less than the 8 cents it earns when exported, so even exported solar pays.
In the documentation: Results dashboard ↗
- 12
Find the grid peak
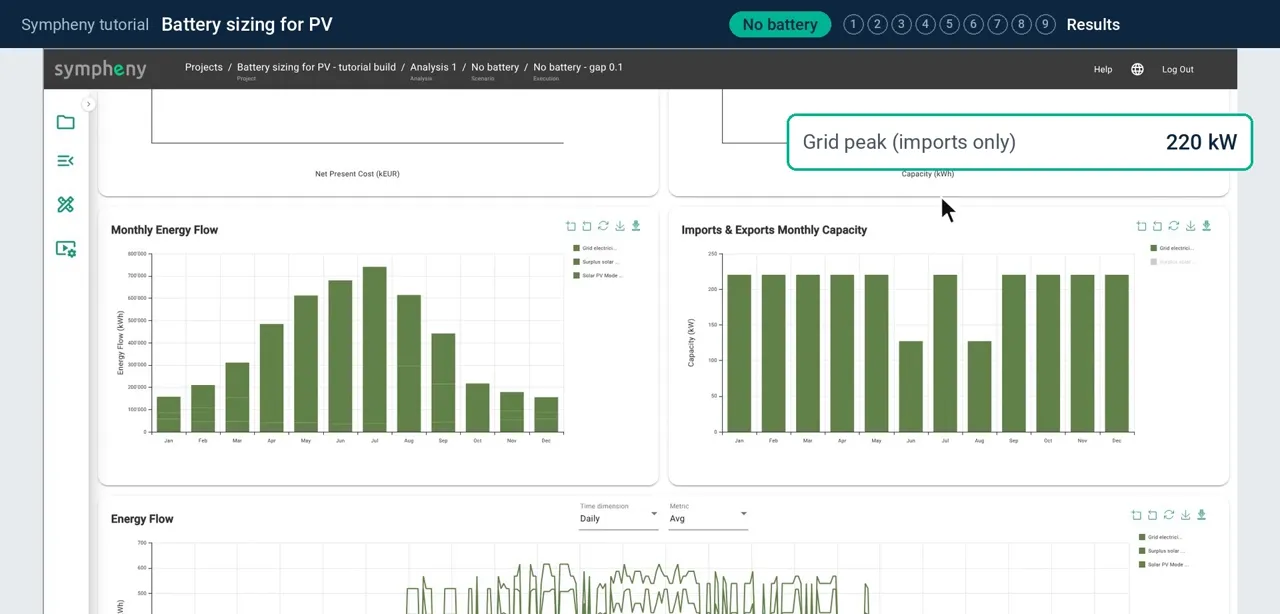
In the monthly imports and exports chart, hide the solar exports to see grid imports only. The peak is 220 kW, and that is what the capacity charge is billed on.
In the documentation: Results dashboard ↗
- 13
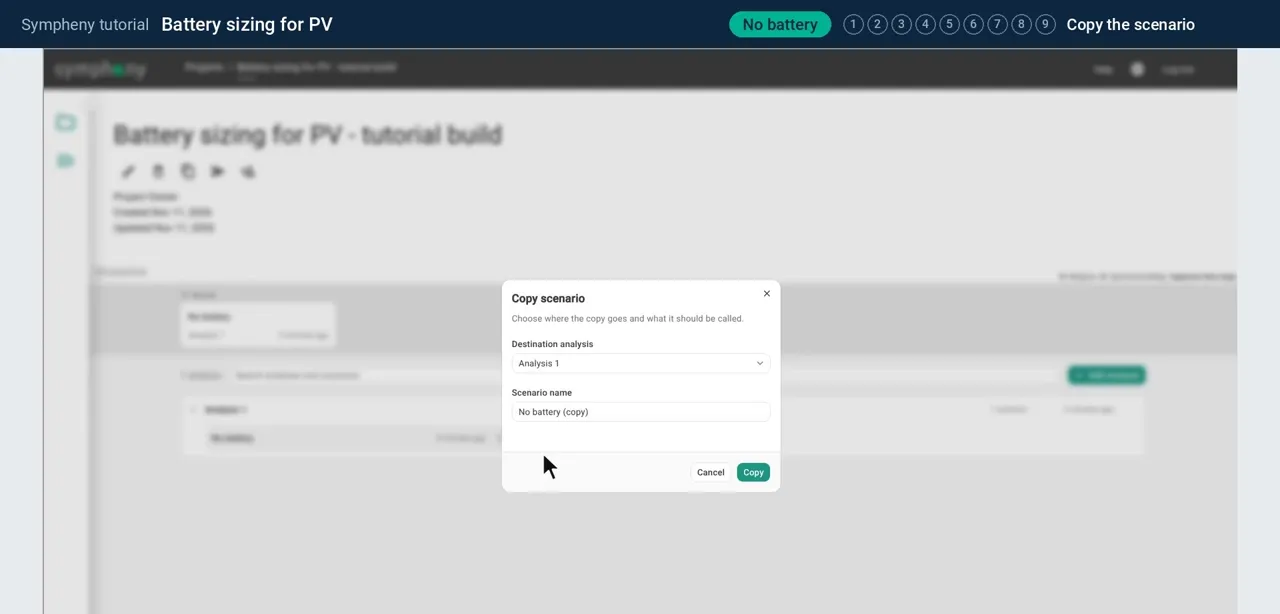
Copy the scenario
Go back to the project, open the scenario menu and click Copy. Name the copy 100 kWh battery.
The copy is identical to No battery. You'll change one thing: add a battery in step 7.
In the documentation: Analyses and scenarios ↗
- 14
Add the battery
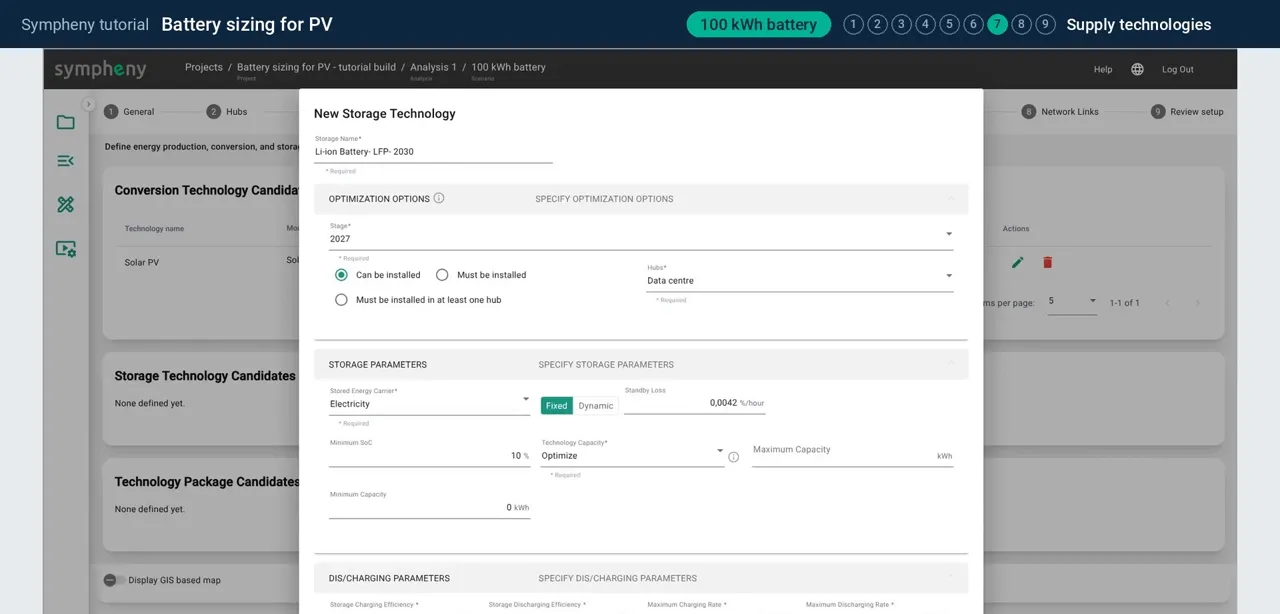
In step 7, under storage technologies, click Add from Database and pick a lithium iron phosphate (LFP) battery.
Set the capacity to 100 kWh and leave it on Can be installed: Sympheny only builds it if it lowers the cost. The diagram now shows the battery next to the solar panels. Run the scenario with the same settings as before.
In the documentation: Supply technologies step ↗
- 15
Compare the two runs
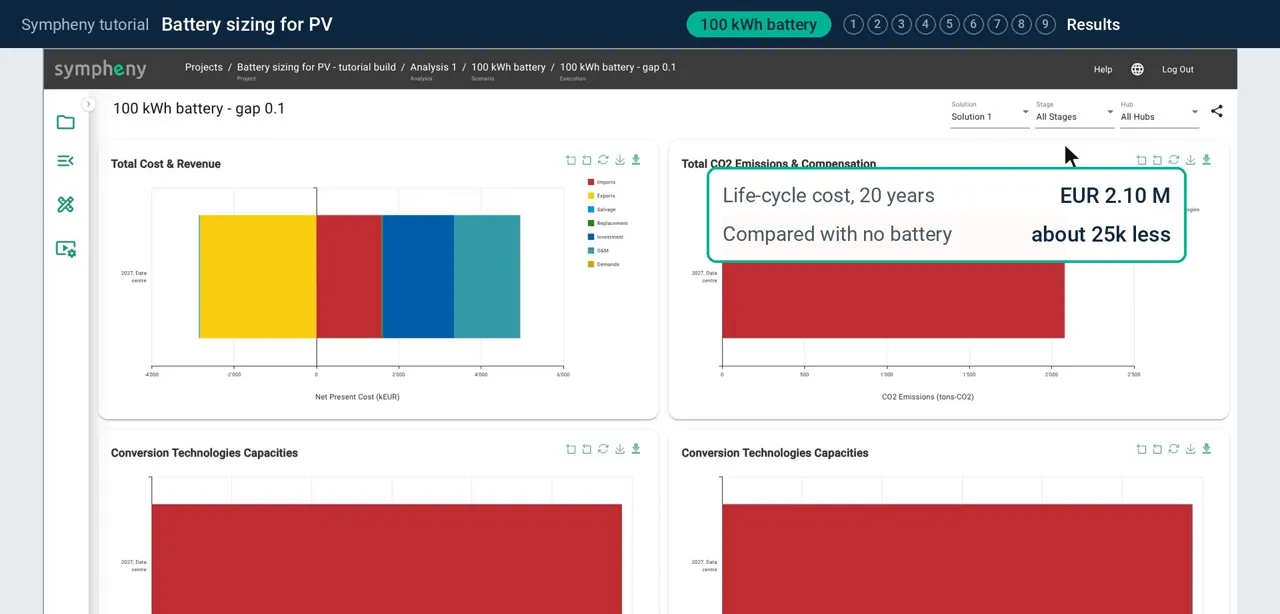
Sympheny builds the battery, and the solar stays the same size. Grid electricity and CO₂ both fall by about 6 %.
The life-cycle cost is EUR 2.10 million, about 25,000 less than without the battery.
In the documentation: Results dashboard ↗
- 16
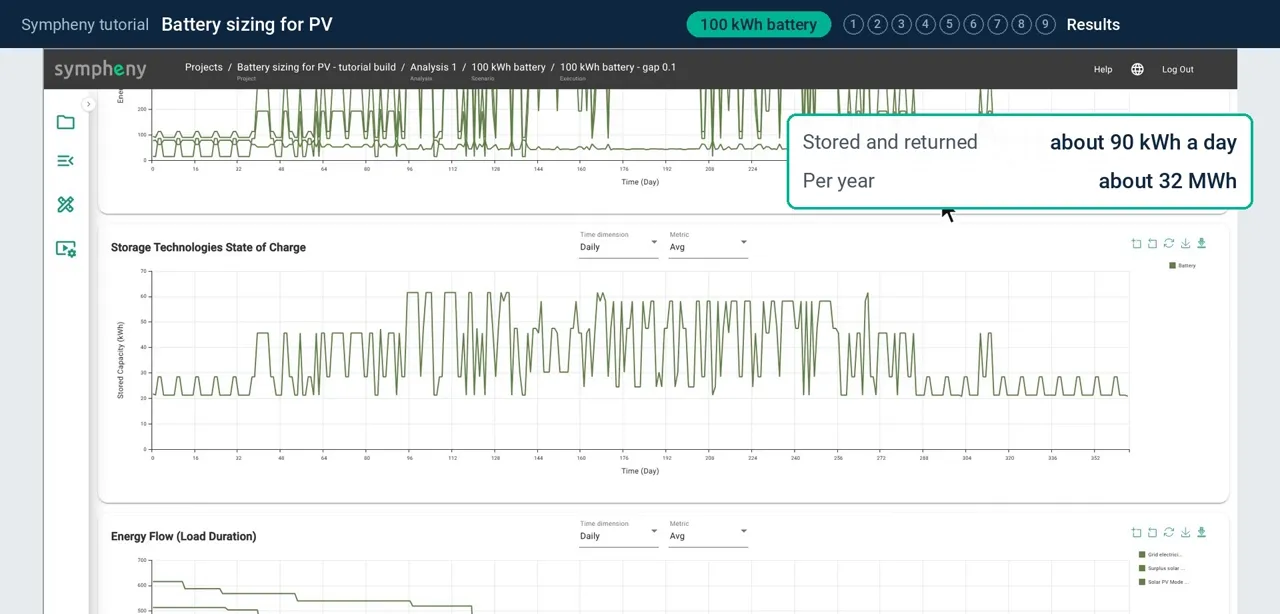
Check the state of charge
The state-of-charge chart shows the battery working almost every day. It stores about 90 kWh of solar and gives it back later, in the evening or at the afternoon peak.
In the documentation: Results dashboard ↗
Results
The battery is built and lowers the life-cycle cost, but not mainly for the reason most people expect.
| No battery | 100 kWh battery | |
|---|---|---|
| Solar PV built | 1,763 kW | 1,763 kW |
| Life-cycle cost (20 years) | EUR 2.13 M | EUR 2.10 M |
| Grid electricity bought | 552 MWh/yr | 520 MWh/yr |
| Solar exported | 1,800 MWh/yr | 1,766 MWh/yr |
| Grid peak | 220 kW | 133 kW |
| CO₂ (20 years) | 2,207 t | 2,079 t |
- Shifting midday solar to the evening saves about EUR 96,000 of grid electricity over 20 years, but that solar is no longer exported (−54,000) and the battery costs about 34,000 over its life. That alone leaves only about +7,000.
- The bigger gain is the peak: the grid peak drops from 220 to 133 kW, which saves about another EUR 17,000 in capacity charges.
- In total the battery returns about EUR 59,000 for 34,000 of cost, about 1.7 times its cost or roughly 25,000 net. Most of the margin comes from the peak.
- The result is price-sensitive: double the battery price and the gain is gone. With a 0 % interest rate, future savings count in full, which flatters the battery. Try it yourself: set the capacity price to zero, try a 5 % interest rate, or set the battery capacity to Optimize.
Try it yourself
Build the model alongside the video in your own Sympheny account, then change one assumption and run it again.
Stuck on a step? Ask our support team. Tell us which tutorial and step, and we'll help you get unstuck. Contact support ↗
Video transcript
This data centre near Geneva uses 1.2 gigawatt-hours of electricity a year,
day and night.
On a sunny day, solar panels on its roof produce far more than it needs at noon,
and nothing at night.
So the surplus goes to the grid, and after sunset the grid supplies everything.
Could a battery help?
Most people expect it to pay by storing midday solar for the evening.
Is a battery worth it? Let's find out.
You'll build the model from scratch in nine steps,
then compare two scenarios: solar only, and solar with a 100 kWh battery.
Start on the projects page.
Click the plus, give the project a name,
and click on the map to place it, here near Geneva.
Then add a first scenario. Call it No battery.
Step one, General. Choose the currency: euros.
Then add a stage.
A stage is the period you plan for: here, twenty years from 2027.
We've left the interest rate at zero to keep the comparison simple.
In a real study, use your own.
Step two, Hubs.
A hub is a place where energy is converted, stored and used.
Here there's just one: the data centre.
Step three, Energy carriers: the forms of energy in the system.
Add Electricity, and Solar Roof, the sunlight on the roof.
Step four, Energy demands.
Click Add New, choose Electricity, and name the demand.
For the hourly profile, choose Upload profile and drop in a file with one
value for every hour of the year.
We prepared one for this data centre.
Open the chart to check it: 1.2 gigawatt-hours a year,
between about 65 and 330 kilowatts.
Step five, On-site resources.
Add the solar roof: 10,000 square metres.
Click Generate profile and pick Geneva, a roof, 15 degrees, facing east.
We keep it simple: the whole roof can be used, with no extra losses.
Step six, Imports and exports.
Buy grid electricity at 15 cents per kilowatt-hour,
with a CO2 intensity of 0.2 kilograms per kilowatt-hour.
And remember this capacity charge: 10 euros per kilowatt of peak demand, per year.
Then add an export: surplus solar, sold at 8 cents.
Step seven, Supply technologies.
Click Add from Database and choose solar panels for roofs over 100 kilowatts.
Costs and an 18 percent efficiency come with it.
Rename it, tick Primary mode, and set the capacity to Optimize.
Sympheny decides how much to build.
Step eight is for networks between hubs. We don't need one.
Step nine shows the whole system as a diagram.
Click Execution Options.
Name the run, pick the scenario and minimise life-cycle cost.
Set the optimality gap to 0.1 percent for a precise answer, and click Execute.
Less than a minute later, the run is done. Open the results.
This chart shows the life-cycle cost: investment, replacements,
maintenance and grid costs over twenty years, minus the export income.
Here, 2.13 million euros.
The Sankey diagram shows where the energy goes.
The wider the band, the more energy.
Sympheny covers the whole roof: about 1,760 kilowatts of solar.
Almost three quarters of it is exported, 1.8 gigawatt-hours a year.
The grid still supplies about 550 megawatt-hours, mostly at night.
Why the whole roof?
Over twenty years, each solar kilowatt-hour costs about 7 cents,
maintenance included.
That's less than the 8 cents it earns when exported, so even exported solar pays.
Hide the solar exports, and this monthly chart shows grid imports only.
The peak is 220 kilowatts, and that's what the capacity charge is billed on.
Now the battery.
Go back to the project, open the scenario menu and click Copy.
Name the copy 100 kWh battery.
The copy is identical, with one change: in step seven, you add a battery.
In Storage technologies, click Add from Database and pick a lithium iron
phosphate battery.
Set the capacity to 100 kilowatt-hours, and leave it on Can be installed.
Sympheny only builds it if it lowers the cost.
The diagram now has the battery next to the solar panels.
Run it the same way, with the same settings.
Sympheny builds the battery, and the solar stays the same size.
Grid electricity and CO2 both fall by about 6 percent.
Life-cycle cost: 2.10 million euros, about 25,000 less than without the battery.
The state of charge shows it working almost every day:
it stores about 90 kilowatt-hours of solar and gives it back later,
in the evening or at the afternoon peak.
First, the expectation.
Storing midday solar for the evening saves 96,000 euros of grid electricity
over twenty years.
But that solar is no longer exported: minus 54,000.
The battery itself costs 34,000 over its life.
That leaves only about 7,000.
Now the twist.
With the battery, the grid peak drops from 220 to 133 kilowatts.
At 10 euros per kilowatt per year, that saves another 17,000 euros.
So the battery returns about 59,000 euros for 34,000 of cost:
about 1.7 times its cost, or 25,000 net.
Most of that margin comes from the peak.
It's price-sensitive: double the battery price and the gain is gone.
And with zero interest, future savings count in full, which flatters the battery.
Your turn.
Set the capacity price to zero and see how much of the gain is left.
Try an interest rate of 5 percent.
Or set the battery capacity to Optimize and let Sympheny size it.
That's the battery sizing tutorial.
If you have questions, we're happy to help.