Port of Innovation · OST
Green Port Kleinhüningen: energy system variants for 2035
Fourteen port clusters optimised as one system: 73% less CO₂e, 57% self-sufficiency and lower annual cost in the selected 2035 variant.
Eight optimised 2035 variants for the Kleinhüningen port area, stress-tested on energy prices, emission factors and whether a port-internal power grid pays off.
- Customer
- Port of Innovation · OST
- Sector
- Industry
- Location
- Basel, Switzerland
- Project type
- Port energy system 2035
- CO₂
- −73%
- Tools
- Sympheny · MILP optimisation · Multi-hub modelling · Multi-objective optimisation · Electricity network optimisation · Price and emission-factor stress tests
Photo: Stephan Leuzinger / Pexels
Find optimised 2035 energy system variants for the Kleinhüningen port area in Basel and compare them on cost, self-sufficiency and CO₂.
Modelled 14 company clusters as one system, optimised eight variants against three objectives, and stress-tested prices, emission factors, a port-internal grid and an LEG.
The selected variant reaches 57% self-sufficiency and cuts emissions by 73% at about CHF 2.1 million a year, below today's CHF 2.5 million; early grid investment comes first.
The challenge
The Kleinhüningen port area in Basel is home to several companies, each with its own buildings, equipment, vehicles and installations. Today the port uses around 9.7 GWh of energy a year, at a total annual cost of about CHF 2.5 million and emissions of about 1,570 t CO₂e.
Fossil fuels and district heating cause 97% of those emissions; purchased electricity only 3%. Rooftop PV already exists, but most of the solar power is fed into the public grid rather than used on site.
Two questions framed the project:
- What do optimised solutions for producing, storing, distributing and using renewable energy across the port area look like?
- Which concrete variants exist, and how do they compare on cost, energy self-sufficiency and CO₂?
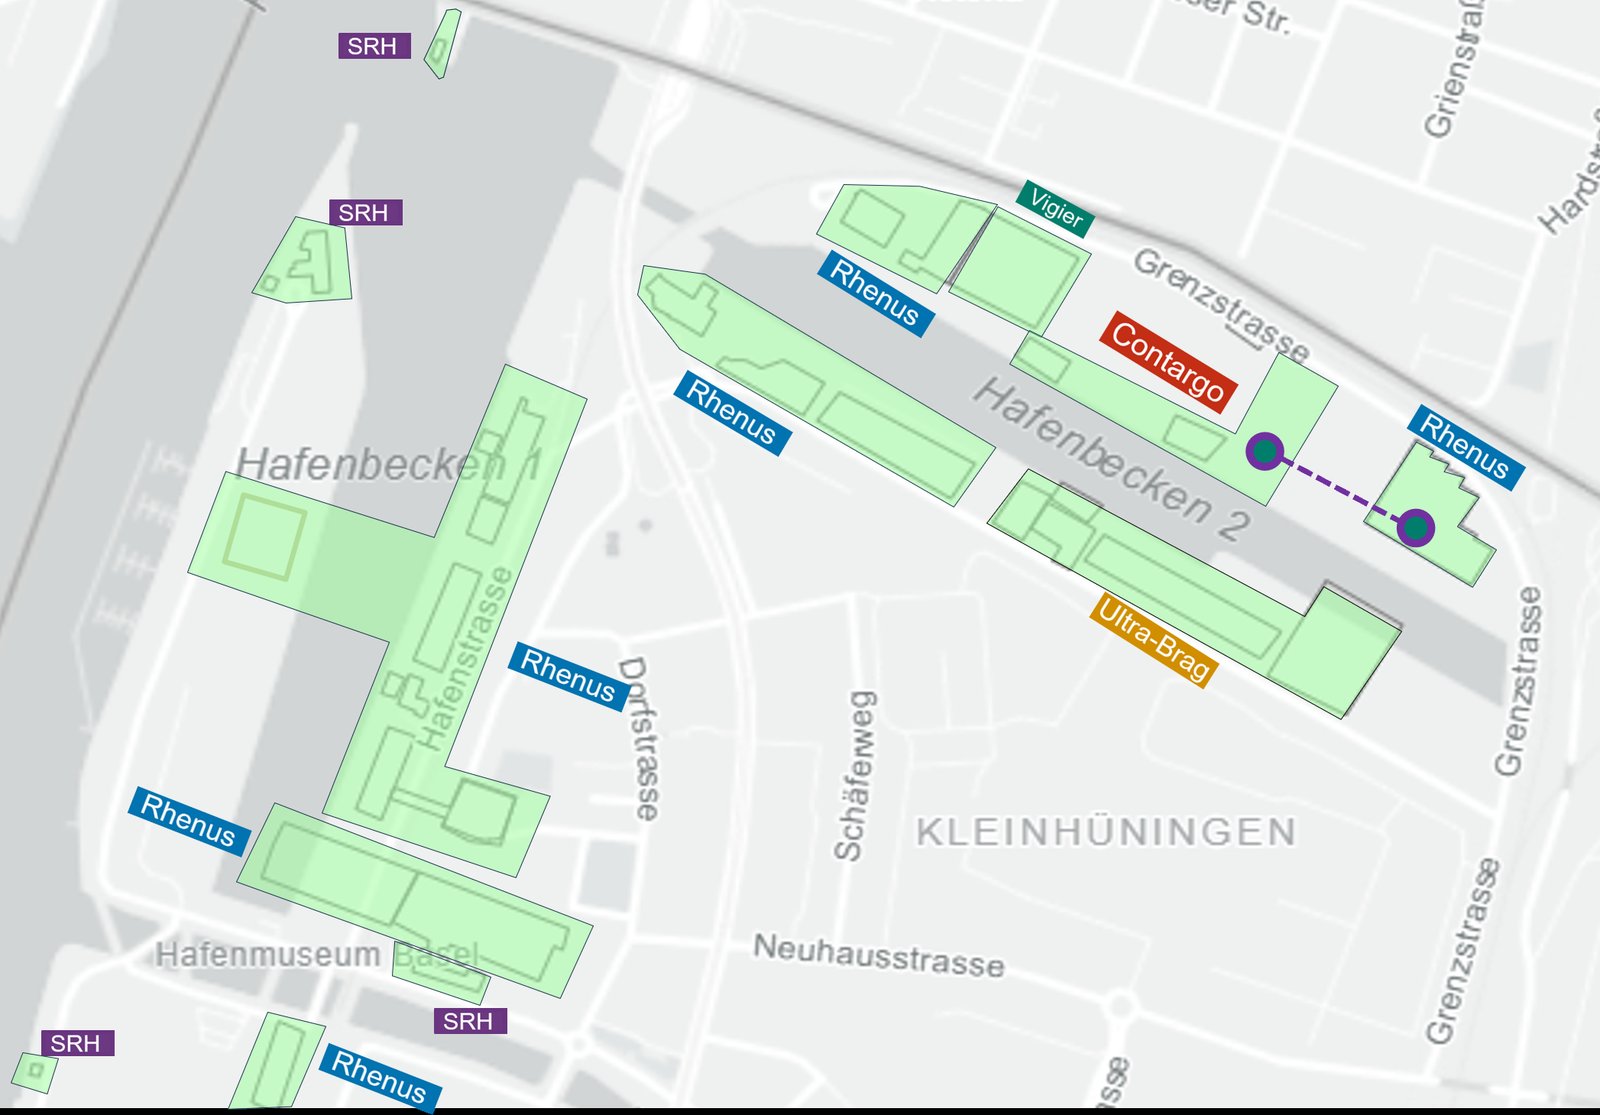
Today: the port’s clusters (green) and their buildings. Only a few are connected electrically.
How Sympheny was used
Together with the Port of Innovation and OST – Eastern Switzerland University of Applied Sciences, the port area was modelled in Sympheny:
- 14 clusters, grouped by location and by port company, each covering its buildings, installations, PV generation and loads.
- A 2035 demand forecast of about 11.7 GWh a year, with heavy electrification of the energy supply.
- Three objectives: lowest life-cycle cost, lowest CO₂ emissions and highest self-sufficiency.
- Eight optimised variants, each defining the technology mix, rooftop and façade PV, battery storage, heat supply and electrical interconnection.
- Stress tests on the selected variants: best- and worst-case energy prices and emission factors, whether interconnecting the port companies pays off at all, and a port-internal power grid compared with a local electricity community (LEG).
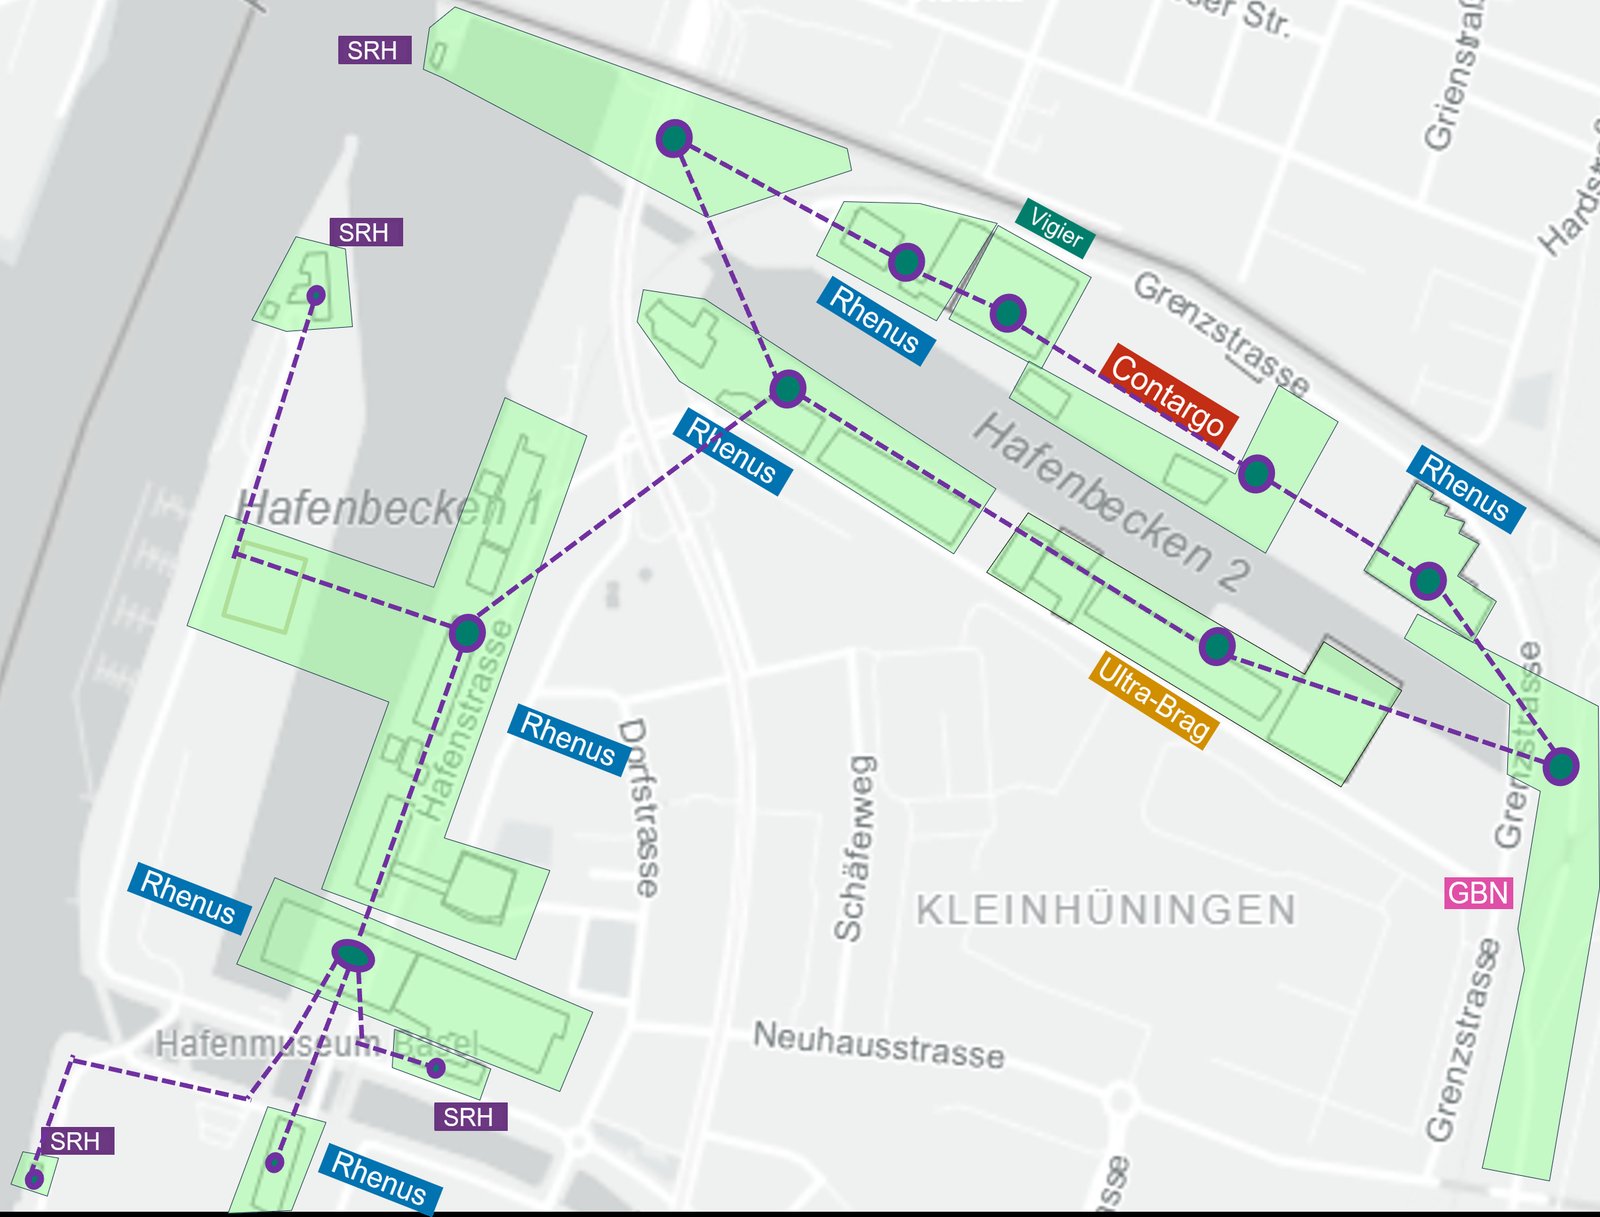
2035 option: a port-internal grid (dashed) links the clusters so solar power can be shared across the port.
Result
Across the eight optimised 2035 variants, life-cycle costs range from CHF 2.1 to 2.8 million a year, residual emissions from 250 to 550 t CO₂e a year, and self-sufficiency from 30 to 60%.
In the selected self-sufficiency variant (V2), PV generation of 8.2 GWh a year, battery storage and a port-internal power grid raise self-sufficiency to 57%. Around 5 GWh of electricity is still imported each year and 2 GWh exported. Emissions fall by 73%, from 1,570 to about 420 t CO₂e a year. This variant also sits at the low end of the cost range, at about CHF 2.1 million a year in life-cycle costs, compared with today’s annual costs of about CHF 2.5 million.
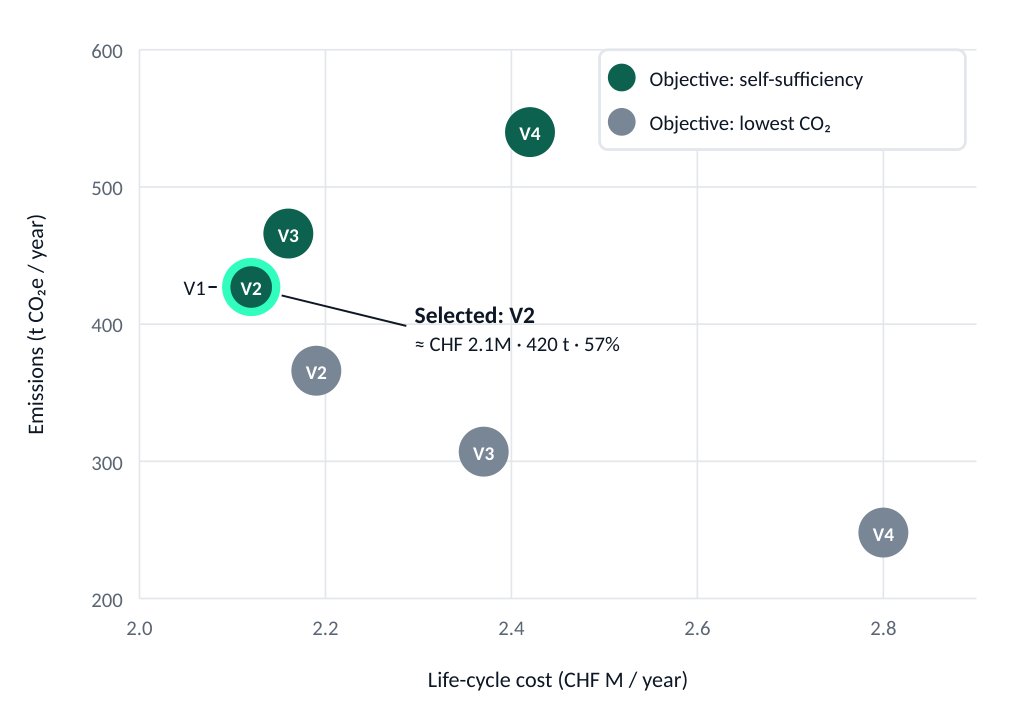
Life-cycle cost vs. emissions for the optimised 2035 variants. Today the port emits about 1,570 t CO₂e a year.
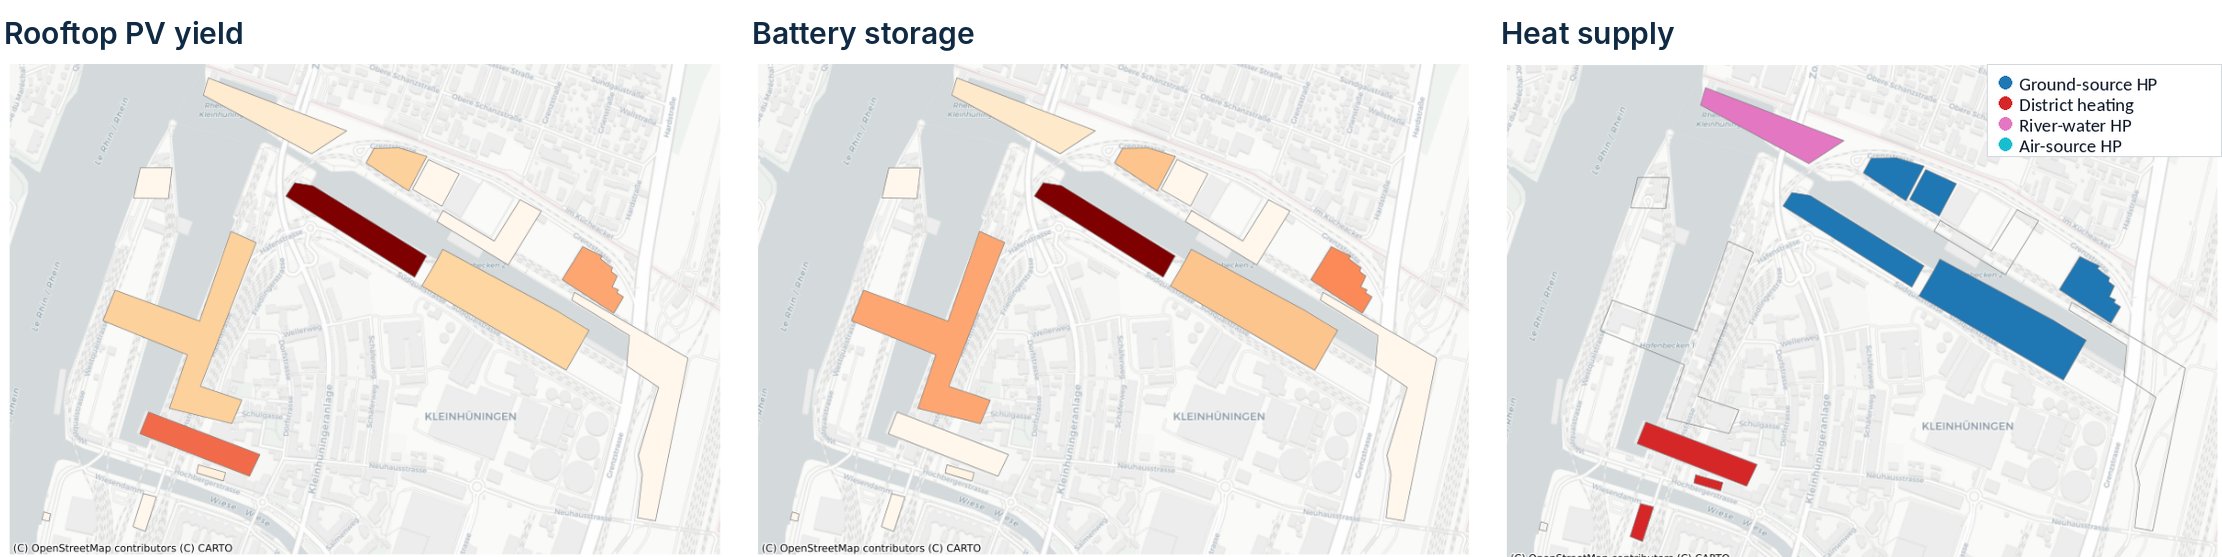
Selected variant V2: rooftop PV yield per building (up to ~2 GWh/a), battery capacity per hub (up to ~5 MWh), and heat-pump type or district heating connection per hub.
Three decisions the model supports
- Robustness: how wide is the range? Running the selected variants with different energy prices and emission factors gives realistic best- and worst-case scenarios and a range of possible costs and emissions.
- Interconnection: is a port-internal power grid worth building? Yes, especially along the north, south and east quays, to distribute the solar power generated there. That holds even if grid electricity gets cheaper, its CO₂e emissions fall, and the costs of the grid connection and PV systems rise.
- Implementation: which investments come first? Connecting the site early is key. Early investment in the grid enables lower energy costs, higher self-consumption and a steady reduction in CO₂ emissions.
Assumptions: grid electricity 29 Rp/kWh + CHF 11.9/kW/month · cabling CHF 1,800/m · self-generated power 11 Rp/kWh + 3 Rp/kWh O&M · LEG electricity 26 Rp/kWh + CHF 8.3/kW/month.
Why it matters
Ports, airports and industrial parks face the same challenge: many energy consumers, local generation potential that is still largely unused on site, and major infrastructure decisions that set the direction for decades.
Modelling the whole system together makes the trade-offs between cost, CO₂ and self-sufficiency visible, and shows which uncertainties remain before long-term investment decisions are made.
Project partners: Port of Innovation · OST – Eastern Switzerland University of Applied Sciences · Sympheny
For the earlier solar and energy-sharing strategy on the same port site, see the IWB case study on the Port of Switzerland. The wider integrated-energy work at the port is published in the ISEC 2026 proceedings.
Across eight optimised 2035 variants, life-cycle costs ranged from CHF 2.1 to 2.8 million per year, residual emissions from 250 to 550 t CO₂e and self-sufficiency from 30 to 60%. In the selected self-sufficiency variant, 8.2 GWh/a of PV, battery storage and a port-internal power grid raise self-sufficiency to 57% and cut emissions by 73%, at about CHF 2.1 million per year, below today's CHF 2.5 million.