One platform for energy scenarios, optimisation, and client-ready outputs.
Sympheny covers the whole planning workflow for technical teams: project setup and data, optimisation, scenario comparison, report export. Every scenario is solved with mixed-integer linear optimisation, so the recommendations rest on the maths, not on rules of thumb.
Used by EWB (City of Bern), IBC Chur, Empa and engineering consultancies across Europe. Swiss Made Software, Empa spin-off. Delivered in India with model support and training from ORMAE, Bengaluru.


One model behind the studies Indian teams are being asked for.
The platform is the same one used across 40+ European projects. What changes in India is the brief, and these are the ones it was made for. Local model support and training come from our optimisation partner ORMAE in Bengaluru.
Captive, group captive and third-party PPA routes compared on your own hourly load data, with storage in the same model.
Solar, storage and grid supply sized together against real outage exposure, so backup becomes a costed investment.
Cooling, solar and storage planned as one system for townships, IT parks and smart-city projects.
Electrolyser, renewable and storage capacities optimised as one industrial system, with production cost visible before capital is committed.
The decarbonisation pathway behind the disclosure, produced by the same model that carries the procurement case.
Planning cooling at district scale? See the district cooling and campus energy use case →
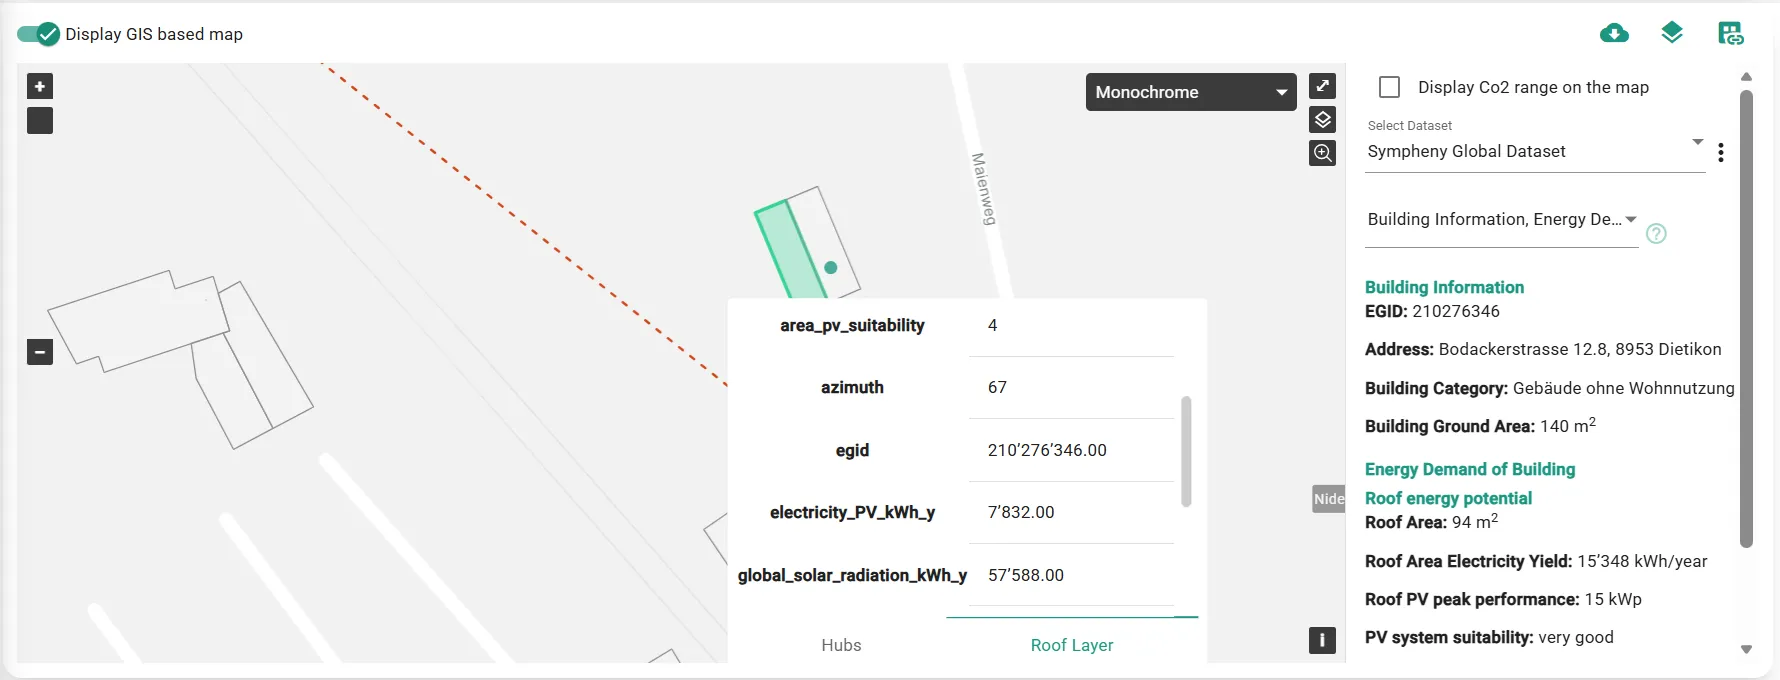
You start with the site's real building data and build a full multi-energy concept from it.
You start from real GIS and building data, optimise across electricity, heat, gas, solar and storage together, and the Sankey, Pareto and dashboard outputs come straight from that same project.

Start from locally relevant assumptions
Every project starts with the data that matters locally: GIS context, building-level information, demand assumptions, roof potential. No rebuilding inputs by hand in spreadsheets.
- Standard load profiles for 50+ building types
- Regional weather and solar irradiation data
- Current CAPEX and OPEX estimates for standard technologies
- CO₂ emission factors by grid region
EWB pulled GIS and smart meter data for all 78 districts of Bern and built a city-wide investment roadmap in 6 weeks. In-house, no outside consultants.
Explore more options than spreadsheets can handle
Sympheny is built specifically for multi-energy system modelling. Its MILP optimiser tests 50,000+ technology and capacity combinations against your project constraints, modelling heat, electricity, cooling, hydrogen and storage together. The design space is far too large to work through by hand.
- Electricity, heating, and cooling networks in one model
- Hourly simulation across a full reference year
- Peak load analysis and battery storage sizing
- Automated capacity optimisation against cost and CO₂ targets
The Insel-Holligen district concept ran against 30+ future energy price and demand scenarios before anyone committed to infrastructure. The recommended design held.

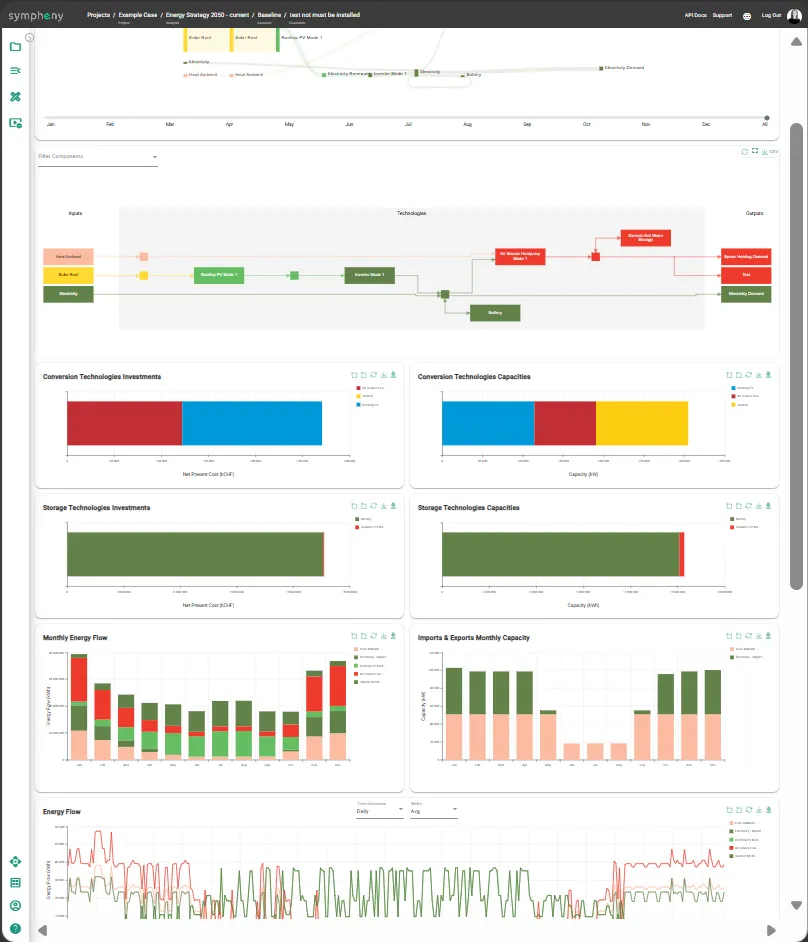
What you present comes straight out of the model
The same model that runs the optimisation produces the visuals your stakeholders see. Sankey flows, Pareto cost/CO₂ charts and scenario dashboards are viewable in the app and printable from the browser, so nothing gets rebuilt in slide decks before a steering committee. And because the project lives as a digital twin, you re-run it when inputs change instead of rebuilding the model.
- Pareto comparison of scenarios on cost, CO₂ and energy mix
- Sankey energy flow visualisations from sources to demand
- Outputs viewable in-app, printable from the browser
- Shareable views for engineers, clients and decision-makers
For IBC Chur, the same model showed a CO₂-free energy supply by 2035 is achievable at life cycle costs close to today's. That finding now drives their long-term infrastructure investment strategy.
A short ramp-up to powerful, flexible energy modelling.
Sympheny gives expert users the flexibility of advanced energy system optimisation without a long implementation burden. For users with prior experience in optimisation or energy-system modelling, the platform can usually be understood in less than a week. Once workflows are established, many studies can be set up in around 30 minutes.
See why most teams recover the license cost after 1-2 projectsTime savings vary by project complexity, input data quality, and team experience. Examples reflect common workflows after the relevant setup is in place.
“With Sympheny I compared far more energy-system variants in my project work than would ever have been possible by hand in Excel. And for each variant I could see straight away what it meant technically, in energy terms, and economically.”
“Sympheny builds charts on cost, CO₂ emissions and performance on its own, and fast. Excel isn't that quick. And you can download the output file directly and keep working with it in Excel. An excellent program when you want to compare several energy solutions at once.”
What Sympheny gives your team
Move faster on every project
Cut the manual setup and build scenarios faster, right from the first project stage.
Multi-energy hub simulations in hours, not weeks.
Connect to meters, GIS, CAD, and other project inputs without manual transcription.
Make decisions you can defend
Compare options with the context and evidence a planning decision needs to hold up.
Reference datasets configured to the regulatory and climate context of each project region.
Make trade-offs visible across technical, cost, and planning criteria.
Deliver and collaborate
Turn the analysis into outputs your stakeholders can use, and keep the team working off the same project.
View Sankey, Pareto and scenario dashboards in the app, and print them directly from the browser.
Support team coordination, versioning, comments, and fast adoption.
Built on advanced energy optimisation technology.
Physics-based modelling, optimisation algorithms, local data layers, cloud infrastructure. Together they let teams compare complex energy scenarios quickly, and back up the results when someone questions them.
Physics-based modelling
Model electricity, heating, cooling, storage, and sector-coupled technologies with engineering-grade assumptions.
50,000+ technology combinations
Search across technology and capacity options to identify cost, CO₂, emissions, space, and performance trade-offs that are impractical to work through by hand. Sympheny's V3 platform includes Sense, a proprietary energy hub solver built on Gurobi. It runs faster than the previous generation and handles more complex hub layouts and constraints.
Data and decision layers
Connect project inputs, benchmarks, GIS context, tariffs, constraints, and scenario outputs so the whole workflow draws on the same data. API, EnyMap and EnyTool options extend this to automation and advanced workflows.
Empa-backed R&D
Built on energy optimisation research that began at Empa in 2014 and commercially deployed through Sympheny since 2020.
Based on peer-reviewed methods for complex energy-system design.
Sympheny's modelling approach builds on published work in MILP energy-hub modelling, district heating layout, electrical grid constraints, structured design workflows, and computational scaling.
Advanced planning needs trusted data, research, and cloud partners.
Sympheny is built with partners in energy research, geospatial analytics, and cloud infrastructure.

Developed with research, optimisation, data, and cloud partners including Gurobi, Empa, Esri, AWS, Berkeley Lab, and Geoimpact. See all integrations →
Built for real planning workflows, not static studies.
Sympheny handles the messy parts of energy planning: site data, GIS context, tariffs, dynamic CO₂ assumptions, optimisation runs, network results, and the outputs you hand to stakeholders.
Other tools make you choose between bundled data with a black-box model or full flexibility with nothing to start from. Sympheny gives you both: ready-to-run data you can override whenever a project needs it.
- GIS and building-level data for faster site setup
- Dynamic tariffs, CO₂ intensity, and hourly profiles
- GIS-enabled hub layout and KPIs in the project workspace
- Single-objective and multi-objective runs for focused or comparative analysis
- API, EnyMap, and EnyTool options for automation and advanced workflows
The optimisation is deterministic, with no AI in the loop.
Every recommendation Sympheny gives you comes from a Mixed-Integer Linear Programming engine. It's traceable and auditable, and the same inputs always produce the same outputs. There is no machine learning in the calculation loop.
Unsupervised clustering groups your input data into typical days so a full year solves in reasonable time. It groups, it doesn't learn: no model is trained and nothing is retained between runs.
Read the full AI & data transparency page →Proven on real planning projects.
Utilities, municipalities and research institutions use Sympheny to deliver energy concepts at the scale their projects demand.
Green hydrogen produced on-site at a cost comparable to diesel, with life-cycle costs cut 26% versus the fossil baseline.
Read the case study →Three city-wide scenarios confirmed a CO₂-free energy supply is achievable by 2035 at similar life cycle costs to today's fossil-based baseline.
Read the case study →One living campus model: 10% CO₂ reduction already achieved, with 25% more modelled toward the 2030 climate-neutrality target.
Read the case study →See the platform in action.
Two short clips showing how teams move through Sympheny, from setting up a project and running the optimisation to the energy flow visualisations stakeholders see in the final report.
Workflow walkthrough
A guided tour of the core workflow: setting up a project, bringing in data, running the optimiser, and comparing scenarios in one model.
Energy flow visualisation
A Sankey-style energy flow from an optimised scenario, the kind of output your team can drop straight into a stakeholder presentation.
Want to see the workflow on a project like yours?
Book a live demo. We'll walk through the platform on a project like yours, so you can see how the workflow fits before you commit.