OIKEN with Amstein+Walthert
Ronquoz21: heating and cooling network planning to 2050
Over 400 energy systems optimised to find the right heating and cooling network for a district growing until 2050.
Nine supply scenarios, 11 sub-districts and four development phases solved together, not one at a time, so the network built in 2030 still makes sense in 2050.
- Cliente
- OIKEN with Amstein+Walthert
- Sector
- Utility
- Localización
- Sion, Switzerland
- Tipo de proyecto
- District heating & cooling network
- Systems
- 400+ energy systems optimised
- Herramientas
- Sympheny · MILP optimisation · Sympheny API & Python toolbox · GIS network path selection · Multi-phase planning · Interactive results dashboards
Photo: Gijs Jakobs / Pexels
Choose a heating and cooling network for the Ronquoz21 district in Sion that holds up across four development phases to 2050.
Built models automatically from GIS and Excel data via the API and Python toolbox, optimised nine scenarios across 11 sub-districts, and shared results in interactive dashboards.
Over 400 unique energy systems optimised, giving OIKEN an objective basis to compare network types, heat sources and routing, and to rule options out.
The challenge
Ronquoz21 is a new district taking shape in the heart of Sion, in the canton of Valais. Over the next 30 years, renovations and new buildings will house about 5,000 residents and 6,000 workplaces, in a development that runs right up to the 2050 net-zero mark. In 2025, OIKEN, the local energy utility, set out to decide how to heat and cool all of it.
The options were wide open, and they all interact:
- Centralised or decentralised heat pumps, at sub-district or building level.
- 60 °C networks or low-temperature networks with free cooling.
- CO₂ or water as the network medium. Sion’s Energypolis campus already hosts a demonstrator of a district heating and cooling network that runs on CO₂ instead of water.
- Heat sources: the Rhône, two to three groundwater extractions, or the existing district heating supply.
On top of that, about 200 buildings across 11 sub-districts will come online over four phases (2020, 2030, 2040, 2050). A network sized for the 2030 buildings has to make sense for the 2050 ones, and a heat source chosen for one sub-district changes the economics of its neighbours. Comparing two or three hand-picked variants, the usual approach, would leave most of that space unexplored.
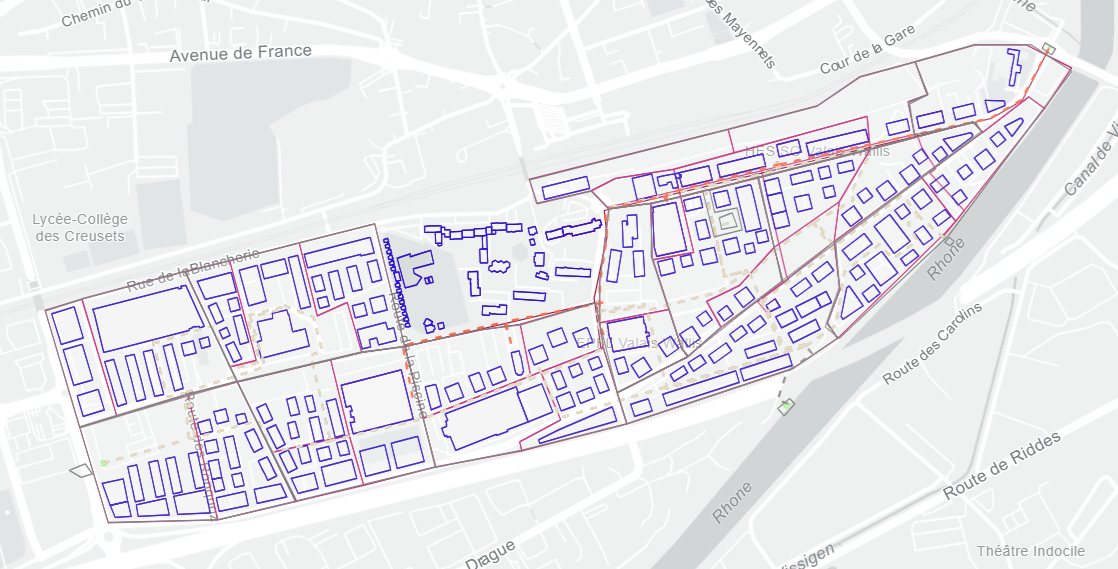
The Ronquoz21 site as modelled in Sympheny: around 200 buildings in 11 sub-districts, five candidate energy sources, and the many network paths explored (dashed lines).
How Sympheny was used
OIKEN brought in Swiss engineering firm Amstein+Walthert and Sympheny. Amstein+Walthert, with long experience in energy planning from districts to whole cities, defined nine supply scenarios: what the heat source is, how heat is distributed, and which heat pump and chiller options exist at sub-district and building level. Sympheny turned those scenarios, plus further data from partners including HES-SO Valais-Wallis, into optimisation models.
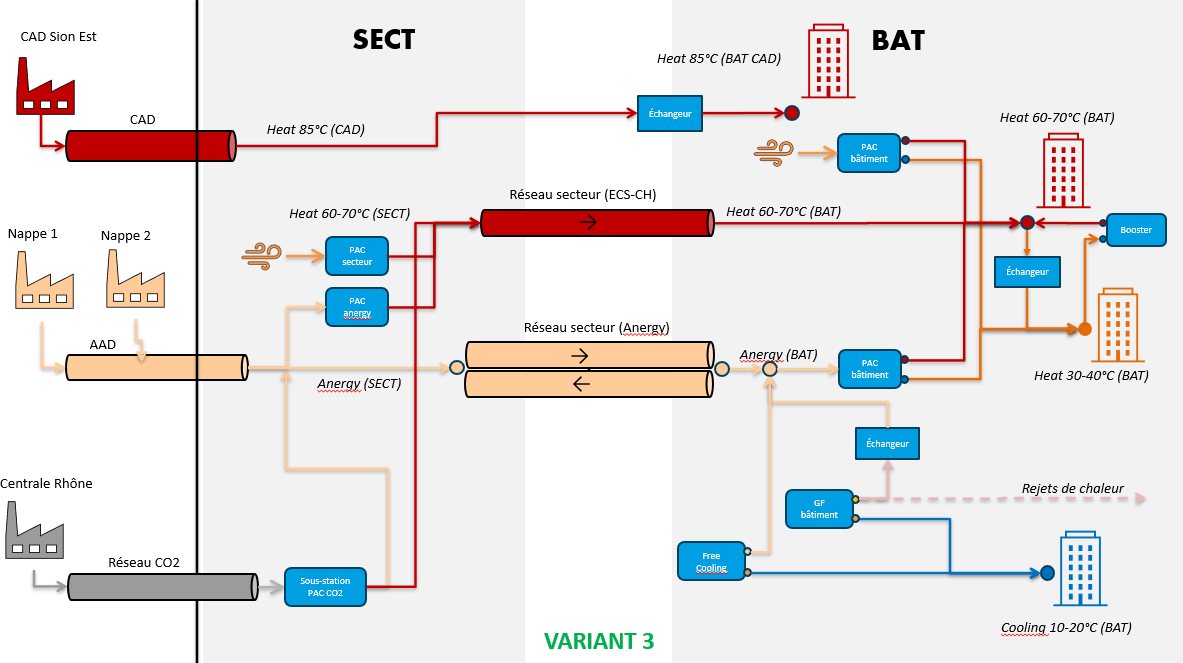
Supply scenario 3, one of nine defined by Amstein+Walthert with OIKEN. Diagram: Amstein+Walthert.
- Automated model building. The data volume was beyond what anyone would enter by hand: hourly heating, hot-water and cooling demand for every building in every phase, plus hundreds of candidate network paths. Using the Sympheny API and Python toolbox, data flowed straight from GIS maps and Excel tables into the optimisation platform.
- Everything optimised together. For each scenario, the MILP optimisation selected the technologies and their sizes, their hourly operation, which network paths to build, which network type to use on each, and how the network grows across the four phases, all to find the highest return on investment.
- Results stakeholders could explore. Nine scenarios, 11 sub-districts and four phases add up to hundreds of energy systems. The Sympheny team built interactive, web-hosted dashboards so every stakeholder could filter, zoom and validate the results from a single, always-current source.
“The biggest challenge was to summarise and display all of the results into comprehensive graphs.” Nelly Ter-borch, customer support, Sympheny
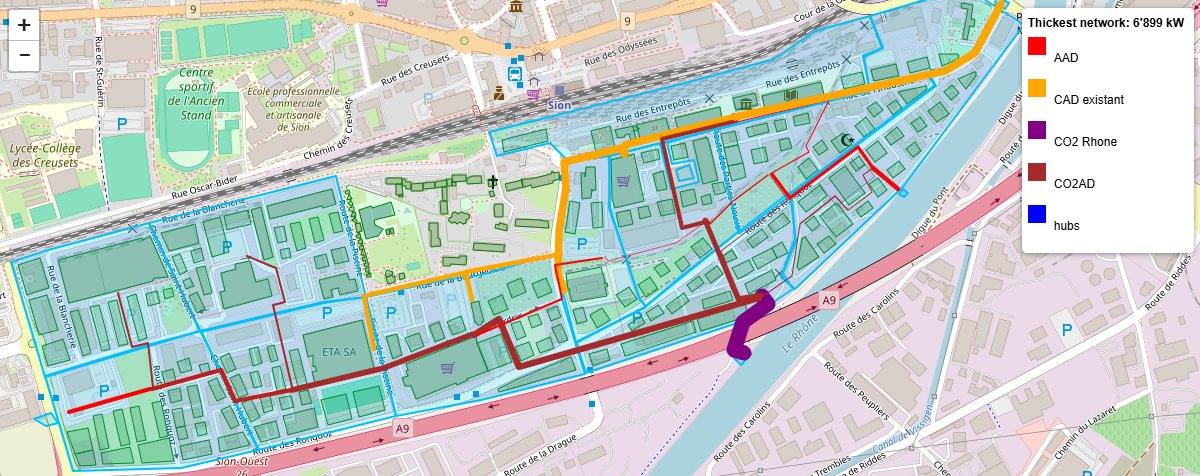
Optimal network layout for one scenario. Colour shows network type, line thickness shows capacity; exact values appear on hover in the dashboard.
Result
Once the pipeline from data to model to dashboard was in place, each new run took minutes, sometimes a couple of hours. The workflow was improved iteratively: results were validated, input data was refined, and the scenarios were re-run. Seeing how quickly a new scenario could be set up and analysed, OIKEN chose to explore further options that had initially been left out.
In the end, more than 400 unique energy systems were optimised, each complete with sizing, costing and hourly operation. Instead of defending a choice between two or three variants, OIKEN can show where each option sits on the cost–emissions trade-off and objectively rule out the ones that don’t hold up, a solid basis for a network that will be built out in phases through to 2050.
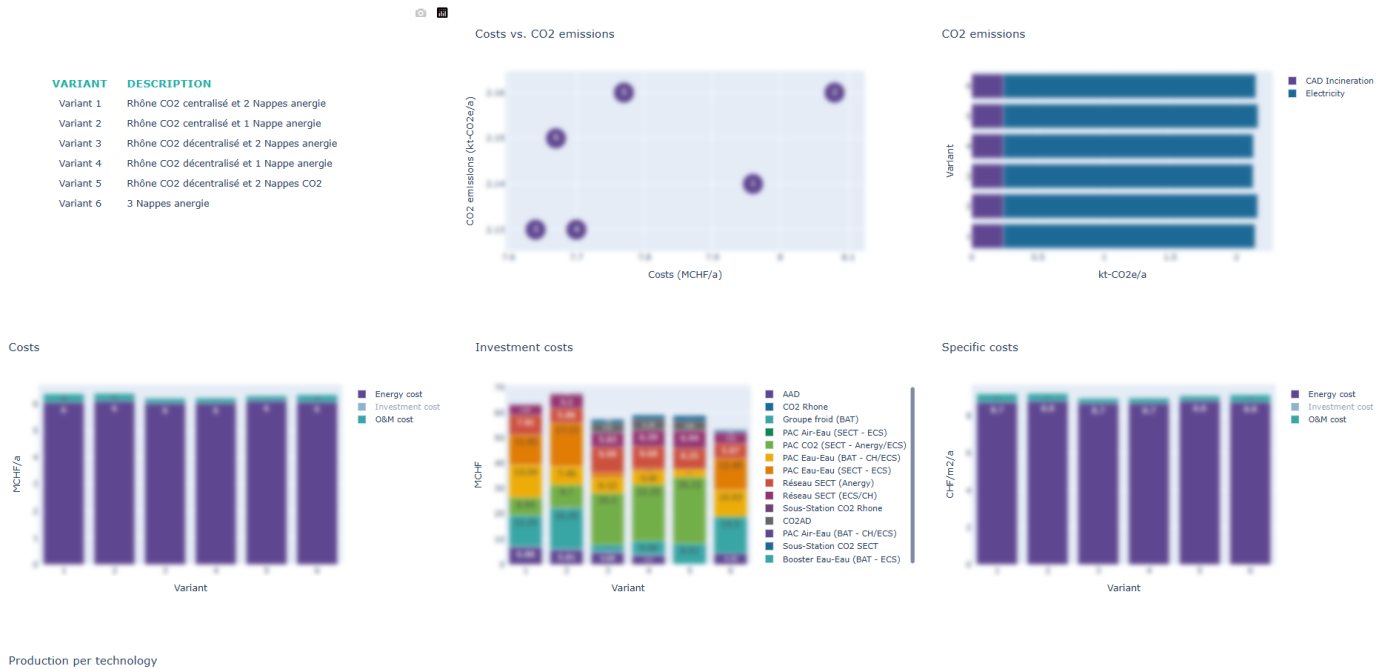
Excerpt from the interactive results dashboard (figures blurred for confidentiality): cost–emissions trade-off, investment by technology and specific costs across variants.
Ronquoz21 is still at an early stage. The detailed results stay confidential while the project develops, and the model will be refined as the district takes shape.
In a 2025 study, more than 400 unique energy systems were optimised, each with technology choice, sizing, hourly operation, network routing and network type across four phases to 2050. OIKEN got a like-for-like comparison of centralised and decentralised heat pumps, 60 °C and low-temperature networks, CO₂ and water networks, and river versus groundwater sources, and used the speed of the workflow to test options it had originally left out.
We used to compare two or three scenarios but now, thanks to Sympheny, we can evaluate dozens of them based on a wide range of economic, environmental, and technical criteria. This allows us to identify the most relevant solutions and objectively rule out certain options, providing the client with a solid basis for decision-making.